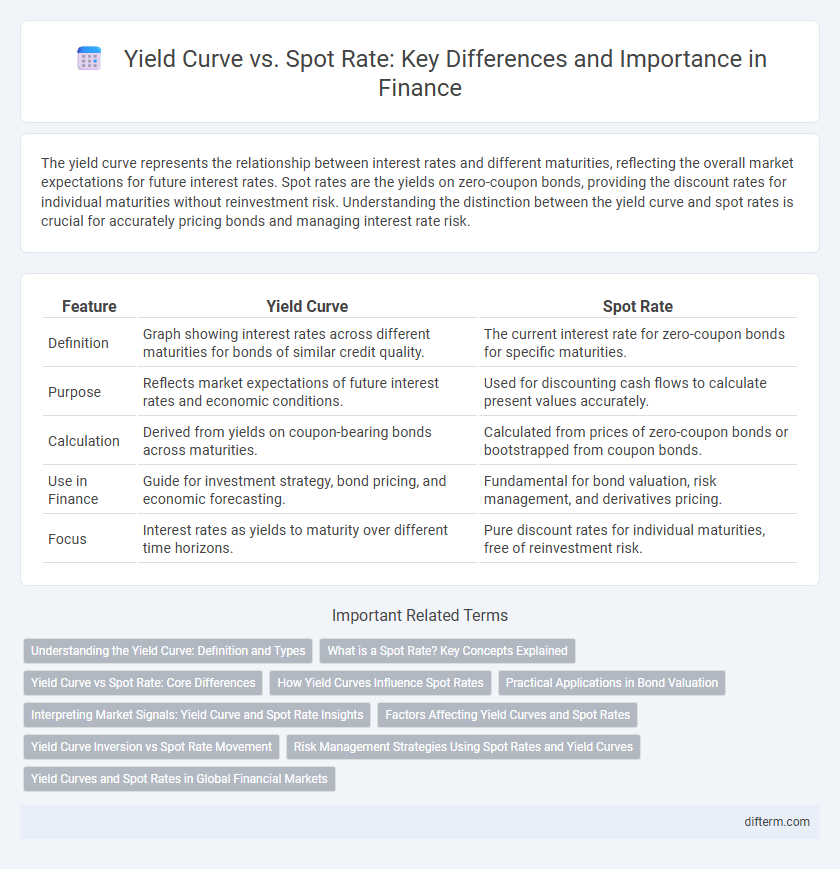
The yield curve represents the relationship between interest rates and different maturities, reflecting the overall market expectations for future interest rates. Spot rates are the yields on zero-coupon bonds, providing the discount rates for individual maturities without reinvestment risk. Understanding the distinction between the yield curve and spot rates is crucial for accurately pricing bonds and managing interest rate risk.
Table of Comparison
| Feature | Yield Curve | Spot Rate |
|---|---|---|
| Definition | Graph showing interest rates across different maturities for bonds of similar credit quality. | The current interest rate for zero-coupon bonds for specific maturities. |
| Purpose | Reflects market expectations of future interest rates and economic conditions. | Used for discounting cash flows to calculate present values accurately. |
| Calculation | Derived from yields on coupon-bearing bonds across maturities. | Calculated from prices of zero-coupon bonds or bootstrapped from coupon bonds. |
| Use in Finance | Guide for investment strategy, bond pricing, and economic forecasting. | Fundamental for bond valuation, risk management, and derivatives pricing. |
| Focus | Interest rates as yields to maturity over different time horizons. | Pure discount rates for individual maturities, free of reinvestment risk. |
Understanding the Yield Curve: Definition and Types
The yield curve graphically represents the relationship between interest rates and different maturities of debt, typically government bonds, revealing market expectations about future interest rates and economic activity. There are three main types: normal (upward sloping), indicating economic growth; inverted (downward sloping), signaling potential recession; and flat, suggesting market uncertainty or transition phases. Understanding these curve shapes helps investors and analysts interpret spot rates, which reflect the true yield of zero-coupon bonds for specific maturities, essential for pricing and managing interest rate risk.
What is a Spot Rate? Key Concepts Explained
A spot rate represents the yield on a zero-coupon bond maturing at a specific future date, reflecting the pure interest rate for that period without reinvestment risk. Unlike the yield curve, which shows yields on bonds with various maturities including coupons, the spot rate isolates the exact discount rate used for pricing cash flows at each point in time. Understanding spot rates is essential for accurate bond valuation, forward rate calculations, and hedging interest rate risk.
Yield Curve vs Spot Rate: Core Differences
The yield curve represents the relationship between interest rates and different maturities of debt, reflecting average yields across various terms, while the spot rate is the current interest rate applicable to a zero-coupon bond for a specific maturity. The yield curve aggregates interest rates and includes expectations about future rates, whereas the spot rate isolates the pure rate for a single point in time without averaging. Understanding the core difference helps investors distinguish between market expectations embedded in the yield curve and the fundamental discount rates indicated by spot rates.
How Yield Curves Influence Spot Rates
Yield curves provide a graphical representation of interest rates across different maturities, directly impacting spot rates, which reflect the cost of borrowing for specific time frames. As the yield curve shifts, spot rates adjust accordingly, with upward-sloping curves indicating higher spot rates for longer maturities due to increased risk premiums. Market expectations, inflation forecasts, and monetary policy are key factors driving changes in the yield curve that, in turn, influence spot rate fluctuations.
Practical Applications in Bond Valuation
The yield curve provides a graphical representation of interest rates across different maturities, essential for estimating bond prices and assessing market expectations of future rates. Spot rates, derived from zero-coupon bonds, serve as the foundational discount factors for accurately valuing cash flows of bonds with varying maturities. Utilizing spot rates eliminates the distortions caused by coupon payments, enabling precise calculation of a bond's intrinsic value and effective yield.
Interpreting Market Signals: Yield Curve and Spot Rate Insights
The yield curve reflects the relationship between interest rates and different maturities, signaling market expectations about economic growth and inflation. Spot rates represent the theoretical yield on zero-coupon bonds for specific maturities, providing a more precise benchmark for valuing cash flows. Comparing yield curves and spot rates helps investors interpret market sentiment, assess risk premia, and anticipate changes in monetary policy.
Factors Affecting Yield Curves and Spot Rates
Interest rate expectations, inflation forecasts, and central bank monetary policies significantly influence both yield curves and spot rates, shaping investment decisions and risk assessments. Market liquidity, credit risk perceptions, and time to maturity also impact yield curve shapes and spot rate levels, reflecting economic conditions and investor demand. Changes in fiscal policy, geopolitical events, and supply-demand imbalances further drive volatility in yield curves and spot rates across different maturities.
Yield Curve Inversion vs Spot Rate Movement
Yield curve inversion occurs when short-term interest rates exceed long-term rates, signaling investor expectations of declining future interest rates and potential economic slowdown. Spot rate movement reflects the instantaneous interest rate for zero-coupon bonds, providing a precise measure for discounting cash flows at specific maturities. Analyzing yield curve inversion alongside spot rate fluctuations reveals market sentiment shifts, highlighting risks of recession and changes in monetary policy expectations.
Risk Management Strategies Using Spot Rates and Yield Curves
Spot rates provide precise discount factors for cash flows at specific maturities, enabling more accurate valuation of bonds and derivatives in risk management. Yield curves, reflecting market expectations and liquidity premiums, help identify shifts in interest rate risks and term structure dynamics. Integrating spot rates with yield curve analysis enhances hedging strategies by isolating specific maturity risks and improving the calibration of interest rate models.
Yield Curves and Spot Rates in Global Financial Markets
Yield curves in global financial markets graphically represent the relationship between bond yields and their maturities, serving as key indicators of economic expectations and interest rate trends. Spot rates, derived from the yield curve, reflect the current risk-free interest rates for zero-coupon bonds at various maturities, providing essential discount factors for pricing fixed-income securities. Analyzing the differential between the yield curve and spot rates enables investors to assess market liquidity, credit risk, and future inflation expectations across diverse economies.
Yield Curve vs Spot Rate Infographic