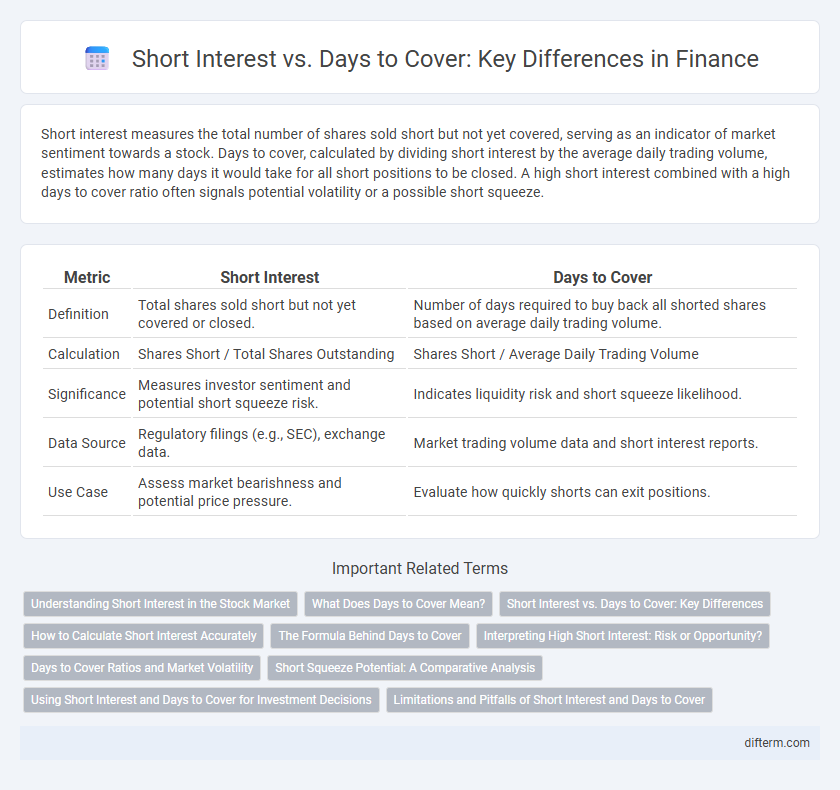
Short interest measures the total number of shares sold short but not yet covered, serving as an indicator of market sentiment towards a stock. Days to cover, calculated by dividing short interest by the average daily trading volume, estimates how many days it would take for all short positions to be closed. A high short interest combined with a high days to cover ratio often signals potential volatility or a possible short squeeze.
Table of Comparison
| Metric | Short Interest | Days to Cover |
|---|---|---|
| Definition | Total shares sold short but not yet covered or closed. | Number of days required to buy back all shorted shares based on average daily trading volume. |
| Calculation | Shares Short / Total Shares Outstanding | Shares Short / Average Daily Trading Volume |
| Significance | Measures investor sentiment and potential short squeeze risk. | Indicates liquidity risk and short squeeze likelihood. |
| Data Source | Regulatory filings (e.g., SEC), exchange data. | Market trading volume data and short interest reports. |
| Use Case | Assess market bearishness and potential price pressure. | Evaluate how quickly shorts can exit positions. |
Understanding Short Interest in the Stock Market
Short interest measures the total number of shares sold short but not yet covered, indicating investor sentiment on a stock's potential decline. Days to cover represents the average time required for short sellers to buy back shares, calculated by dividing short interest by average daily trading volume. High short interest combined with a low days to cover ratio can signal potential short squeeze risks, impacting stock volatility and price movements.
What Does Days to Cover Mean?
Days to cover represents the ratio of a stock's short interest to its average daily trading volume, indicating how many days it would take for short sellers to buy back shares and close their positions. A higher days to cover value signals potential difficulty for short sellers to exit positions quickly, often leading to increased volatility. This metric is crucial for investors evaluating short squeeze risks and market sentiment.
Short Interest vs. Days to Cover: Key Differences
Short interest measures the total number of shares of a stock that are currently sold short and not yet covered or closed out, reflecting market sentiment towards the stock. Days to cover, also known as the short interest ratio, is calculated by dividing the short interest by the average daily trading volume, indicating how many days it would take for shorts to cover their positions based on typical trading activity. While short interest provides a snapshot of bearish bets on a stock, days to cover offers insight into the potential difficulty and time frame required to close out these positions, which can signal possible short squeeze risks.
How to Calculate Short Interest Accurately
To calculate short interest accurately, divide the total number of shares sold short by the average daily trading volume, yielding the days to cover metric. This ratio indicates how many days it would take for all short positions to be bought back, reflecting market sentiment and potential short squeeze risks. Precise short interest data from reliable sources, combined with updated volume figures, ensures an accurate and timely assessment of short-selling activity.
The Formula Behind Days to Cover
Days to cover is calculated by dividing the total short interest by the average daily trading volume of a stock, indicating how many days it would take for short sellers to buy back all shares on loan. High days to cover values suggest potential short squeeze risks, as a large short interest relative to trading volume means buybacks could significantly impact the stock price. Monitoring this ratio helps investors assess market sentiment and the pressure on short sellers in volatile trading environments.
Interpreting High Short Interest: Risk or Opportunity?
High short interest indicates a significant portion of a stock's float is sold short, reflecting bearish sentiment or anticipation of price decline, but it also signals potential for a short squeeze if buying pressure surges. Days to cover, calculated by dividing short interest by average daily trading volume, measures how long it would take short sellers to close their positions, with higher values amplifying the risk of rapid price spikes. Investors interpret a combination of elevated short interest and high days to cover as both a warning of downside risk and a possible opportunity for substantial gains if market conditions shift.
Days to Cover Ratios and Market Volatility
Days to Cover Ratios, calculated by dividing short interest by average daily trading volume, provide critical insight into market volatility and potential price movements. Higher ratios indicate greater market stress, as it may take longer for short sellers to close their positions, often leading to sharp price swings and increased volatility. Monitoring Days to Cover alongside short interest helps investors anticipate short squeezes and assess risk in volatile market conditions.
Short Squeeze Potential: A Comparative Analysis
Short interest measures the percentage of a stock's float that is sold short, while days to cover represents the time required for all short positions to be repurchased based on average daily volume. A high short interest combined with a low days to cover ratio indicates significant short squeeze potential, as rapid buying pressure can force short sellers to cover quickly. Monitoring both metrics together provides investors with critical insights into possible short squeeze scenarios in volatile markets.
Using Short Interest and Days to Cover for Investment Decisions
Short interest measures the total number of shares sold short but not yet covered, providing an indicator of market sentiment toward a stock. Days to cover, calculated by dividing short interest by average daily trading volume, reveals how many days it would take for short sellers to buy back shares, highlighting potential short squeeze risk. Investors use these metrics together to assess bearish sentiment intensity and timing, informing strategic decisions on stock entry or exit points.
Limitations and Pitfalls of Short Interest and Days to Cover
Short interest and days to cover metrics can be misleading due to delayed reporting and lack of granularity in real-time market conditions. These indicators fail to capture short selling activity variations caused by intra-day trading, options hedging, or synthetic short exposure. Relying solely on these metrics risks misjudging market sentiment, as they do not account for the complexities of market liquidity and the potential for short squeeze dynamics.
short interest vs days to cover Infographic