The Sharpe Ratio measures risk-adjusted return by considering total volatility, making it suitable for evaluating overall portfolio performance. The Sortino Ratio refines this by focusing only on downside risk, providing a clearer picture of downside volatility's impact on returns. Investors seeking to minimize losses often prefer the Sortino Ratio as it differentiates harmful volatility from overall fluctuations.
Table of Comparison
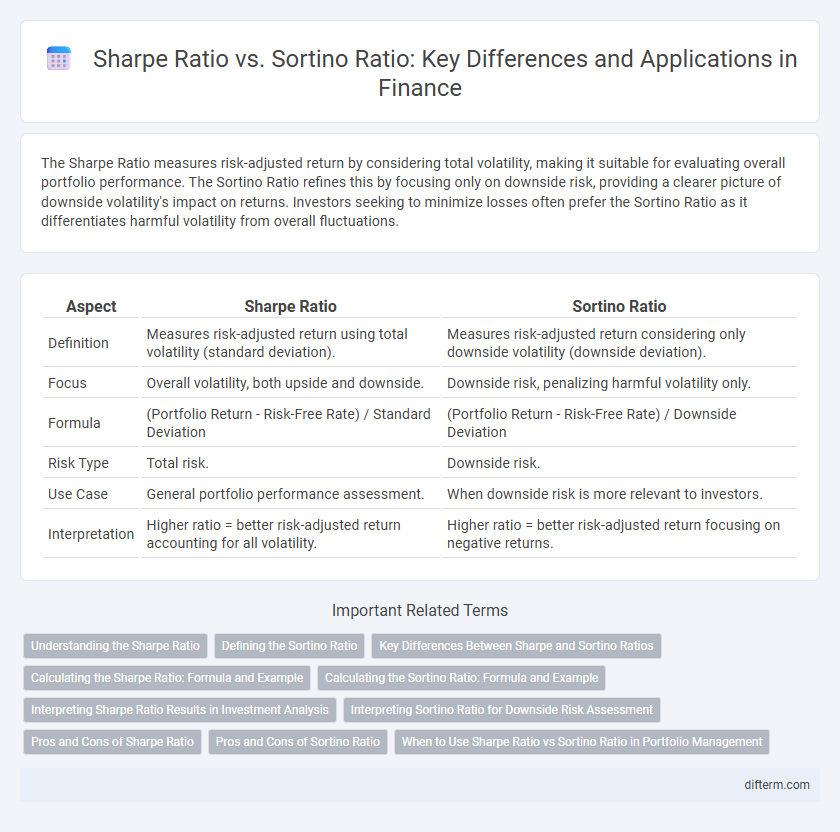
| Aspect | Sharpe Ratio | Sortino Ratio |
|---|---|---|
| Definition | Measures risk-adjusted return using total volatility (standard deviation). | Measures risk-adjusted return considering only downside volatility (downside deviation). |
| Focus | Overall volatility, both upside and downside. | Downside risk, penalizing harmful volatility only. |
| Formula | (Portfolio Return - Risk-Free Rate) / Standard Deviation | (Portfolio Return - Risk-Free Rate) / Downside Deviation |
| Risk Type | Total risk. | Downside risk. |
| Use Case | General portfolio performance assessment. | When downside risk is more relevant to investors. |
| Interpretation | Higher ratio = better risk-adjusted return accounting for all volatility. | Higher ratio = better risk-adjusted return focusing on negative returns. |
Understanding the Sharpe Ratio
The Sharpe Ratio measures the risk-adjusted return of an investment by comparing its excess return to the total volatility, represented by standard deviation. It helps investors evaluate how much return they receive for each unit of overall risk taken, emphasizing total variability rather than downside risk alone. While the Sortino Ratio refines this by focusing solely on downside deviation, the Sharpe Ratio remains a fundamental metric for assessing portfolio performance and risk efficiency.
Defining the Sortino Ratio
The Sortino Ratio measures risk-adjusted return by differentiating harmful volatility from overall volatility, focusing exclusively on downside risk. Unlike the Sharpe Ratio, which penalizes both upside and downside volatility equally, the Sortino Ratio uses the target or required rate of return as the benchmark to isolate negative deviations. This provides investors with a more accurate assessment of performance relative to downside risk, making it especially useful in evaluating the risk-return profile of investments with asymmetric return distributions.
Key Differences Between Sharpe and Sortino Ratios
The Sharpe Ratio measures risk-adjusted return by considering total volatility, using standard deviation as a risk metric, while the Sortino Ratio only accounts for downside volatility, focusing on negative deviations below a target return. Sharpe's approach treats all volatility--both upside and downside--as risk, whereas Sortino differentiates harmful volatility from favorable fluctuations, providing a more precise evaluation of downside risk. Investors seeking to assess performance relative to harmful volatility prefer the Sortino Ratio, whereas those evaluating overall portfolio volatility use the Sharpe Ratio for comparative analysis.
Calculating the Sharpe Ratio: Formula and Example
The Sharpe Ratio is calculated by subtracting the risk-free rate from the portfolio's return and then dividing the result by the portfolio's standard deviation, representing total volatility. For example, if a portfolio returns 12%, the risk-free rate is 3%, and the standard deviation is 8%, the Sharpe Ratio is (0.12 - 0.03)/0.08 = 1.125. This metric helps investors assess risk-adjusted returns by considering both reward and overall risk.
Calculating the Sortino Ratio: Formula and Example
Calculating the Sortino Ratio involves dividing the portfolio's excess return over the risk-free rate by the downside deviation, focusing exclusively on negative asset returns to assess risk more accurately. The formula is: Sortino Ratio = (Rp - Rf) / sd, where Rp is the portfolio return, Rf is the risk-free rate, and sd represents the standard deviation of downside returns. For example, if a portfolio has an annual return of 12%, a risk-free rate of 3%, and a downside deviation of 7%, the Sortino Ratio equals (0.12 - 0.03) / 0.07, resulting in 1.29, indicating efficient risk-adjusted performance by penalizing only harmful volatility.
Interpreting Sharpe Ratio Results in Investment Analysis
The Sharpe Ratio measures risk-adjusted return by comparing portfolio excess returns to total volatility, helping investors assess overall performance consistency. Interpreting Sharpe Ratio results involves evaluating whether returns adequately compensate for total risk, with higher ratios indicating more favorable risk-return profiles. Unlike the Sortino Ratio, which focuses on downside volatility, the Sharpe Ratio accounts for both upside and downside variations, making it essential for comprehensive investment analysis.
Interpreting Sortino Ratio for Downside Risk Assessment
The Sortino Ratio offers a refined perspective on investment performance by isolating downside risk, measuring returns relative to the volatility of negative asset returns instead of total volatility like the Sharpe Ratio. This approach provides investors with a clearer assessment of downside risk exposure, enabling more targeted risk-adjusted return evaluations specifically focused on harmful fluctuations. Consequently, the Sortino Ratio is particularly valuable for risk-averse investors seeking to minimize losses without penalizing upside variability inherent in financial portfolios.
Pros and Cons of Sharpe Ratio
The Sharpe Ratio measures risk-adjusted return by comparing portfolio excess return to total volatility, offering a straightforward and widely accepted risk performance metric. However, it treats upside and downside volatility equally, potentially penalizing portfolios with high positive returns while overlooking downside risk specifically. This limitation can misrepresent risk for investors focused on downside protection, making the Sortino Ratio a preferable alternative in such cases.
Pros and Cons of Sortino Ratio
The Sortino Ratio improves risk assessment by focusing solely on downside volatility, making it a better metric for investors who prioritize downside risk over total volatility. It effectively differentiates harmful volatility from overall variability, offering a clearer insight into negative returns compared to the Sharpe Ratio, which treats all volatility equally. However, the Sortino Ratio's reliance on a predefined target return or minimum acceptable return can introduce subjectivity, and it may underrepresent the impact of upside volatility on portfolio performance.
When to Use Sharpe Ratio vs Sortino Ratio in Portfolio Management
The Sharpe Ratio is ideal for evaluating portfolio performance when returns are symmetrically distributed and total volatility is a relevant risk measure. The Sortino Ratio should be preferred when downside risk, specifically negative deviations or losses, is a primary concern in portfolio management. Investors focused on minimizing downside risk use the Sortino Ratio to better capture the impact of harmful returns compared to the Sharpe Ratio's emphasis on overall volatility.
Sharpe Ratio vs Sortino Ratio Infographic