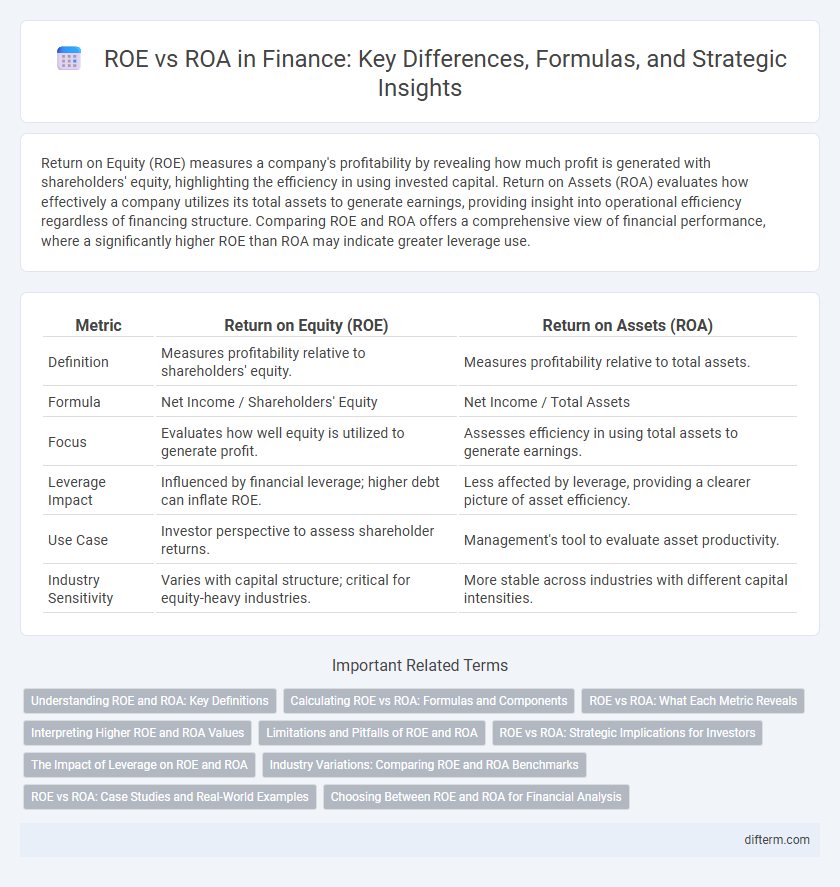
Return on Equity (ROE) measures a company's profitability by revealing how much profit is generated with shareholders' equity, highlighting the efficiency in using invested capital. Return on Assets (ROA) evaluates how effectively a company utilizes its total assets to generate earnings, providing insight into operational efficiency regardless of financing structure. Comparing ROE and ROA offers a comprehensive view of financial performance, where a significantly higher ROE than ROA may indicate greater leverage use.
Table of Comparison
| Metric | Return on Equity (ROE) | Return on Assets (ROA) |
|---|---|---|
| Definition | Measures profitability relative to shareholders' equity. | Measures profitability relative to total assets. |
| Formula | Net Income / Shareholders' Equity | Net Income / Total Assets |
| Focus | Evaluates how well equity is utilized to generate profit. | Assesses efficiency in using total assets to generate earnings. |
| Leverage Impact | Influenced by financial leverage; higher debt can inflate ROE. | Less affected by leverage, providing a clearer picture of asset efficiency. |
| Use Case | Investor perspective to assess shareholder returns. | Management's tool to evaluate asset productivity. |
| Industry Sensitivity | Varies with capital structure; critical for equity-heavy industries. | More stable across industries with different capital intensities. |
Understanding ROE and ROA: Key Definitions
Return on Equity (ROE) measures a company's profitability relative to shareholders' equity, indicating how effectively management uses equity investments to generate profits. Return on Assets (ROA) assesses net income generated from total assets, reflecting overall asset efficiency regardless of financing structure. Both ROE and ROA provide crucial insights into financial performance, with ROE highlighting shareholder returns and ROA emphasizing operational efficiency.
Calculating ROE vs ROA: Formulas and Components
Return on Equity (ROE) is calculated by dividing Net Income by Shareholders' Equity, measuring profitability relative to owners' investments, while Return on Assets (ROA) is derived from Net Income divided by Total Assets, indicating how efficiently assets generate profit. Key components influencing ROE include net profit margin, asset turnover, and financial leverage, whereas ROA primarily depends on operational efficiency reflected in net profit margin and asset utilization. Analyzing both metrics together helps assess the company's financial performance from both ownership and asset management perspectives.
ROE vs ROA: What Each Metric Reveals
Return on Equity (ROE) measures a company's profitability by revealing how efficiently it generates profits from shareholders' equity, highlighting investor returns. Return on Assets (ROA) indicates the company's ability to generate earnings from its total assets, reflecting operational efficiency. Comparing ROE and ROA helps identify the impact of financial leverage, where a higher ROE relative to ROA suggests greater use of debt to boost equity returns.
Interpreting Higher ROE and ROA Values
Higher Return on Equity (ROE) indicates a company's efficiency in generating profit from shareholders' equity, reflecting strong financial leverage and effective management. A higher Return on Assets (ROA) signifies efficient use of assets to produce earnings, highlighting operational performance regardless of financing structure. Comparing ROE and ROA helps investors understand the impact of debt on profitability and assess risk-adjusted returns.
Limitations and Pitfalls of ROE and ROA
ROE can be misleading due to high financial leverage, which inflates returns and masks underlying business performance, while ROA may undervalue asset-intensive firms by ignoring leverage effects. Both metrics are susceptible to accounting distortions--such as earnings management and asset write-downs--that can skew profitability signals. Investors should consider these limitations alongside other financial ratios and qualitative factors to gain a comprehensive view of a company's financial health.
ROE vs ROA: Strategic Implications for Investors
Return on Equity (ROE) measures profitability relative to shareholders' equity, highlighting how effectively a company generates profit from invested capital, while Return on Assets (ROA) assesses efficiency in using total assets to produce earnings. A high ROE coupled with a low ROA can indicate heavy financial leverage, which increases risk but may enhance returns for investors seeking growth opportunities. Understanding the balance between ROE and ROA helps investors evaluate risk-adjusted performance and make informed strategic decisions based on a company's capital structure and asset utilization.
The Impact of Leverage on ROE and ROA
Leverage amplifies Return on Equity (ROE) by increasing debt financing relative to equity, which can boost shareholders' returns when the firm earns more on assets than the cost of debt. Return on Assets (ROA) remains unaffected by leverage, reflecting operational efficiency by measuring net income generated per dollar of assets without regard to financing structure. High leverage elevates financial risk, potentially increasing ROE volatility while ROA provides a stable indicator of core profitability.
Industry Variations: Comparing ROE and ROA Benchmarks
Return on Equity (ROE) and Return on Assets (ROA) benchmarks vary significantly across industries due to differing capital structures and asset intensity. Capital-intensive sectors like manufacturing typically show lower ROA but higher ROE driven by leverage, while asset-light industries such as technology often report higher ROA and relatively moderate ROE. Analyzing industry-specific ROE and ROA ratios provides critical insights for investors assessing operational efficiency and financial leverage.
ROE vs ROA: Case Studies and Real-World Examples
Case studies comparing Return on Equity (ROE) and Return on Assets (ROA) reveal how financial leverage impacts profitability metrics across industries. For instance, banks typically exhibit higher ROE relative to ROA due to extensive use of debt, while tech companies often show closer alignment between ROE and ROA given lower leverage levels. Real-world examples demonstrate that analyzing both ratios together provides deeper insights into capital efficiency and risk management strategies.
Choosing Between ROE and ROA for Financial Analysis
Return on Equity (ROE) measures profitability relative to shareholders' equity, emphasizing how effectively a company uses invested capital to generate earnings. In contrast, Return on Assets (ROA) evaluates overall asset efficiency, highlighting how well a company utilizes its total assets to produce profit. Selecting between ROE and ROA depends on whether the analysis prioritizes equity shareholders' returns or the comprehensive asset base's performance in generating income.
ROE vs ROA Infographic