The P/E ratio measures a company's stock price relative to its earnings per share, highlighting profitability from a shareholder's perspective, while EV/EBITDA evaluates enterprise value against earnings before interest, taxes, depreciation, and amortization, offering a more comprehensive view of operational performance. EV/EBITDA accounts for debt and cash levels, making it a preferred metric for comparing companies with different capital structures in the finance sector. Investors in finance pets benefit from analyzing both ratios to assess valuation accuracy and underlying cash flow health.
Table of Comparison
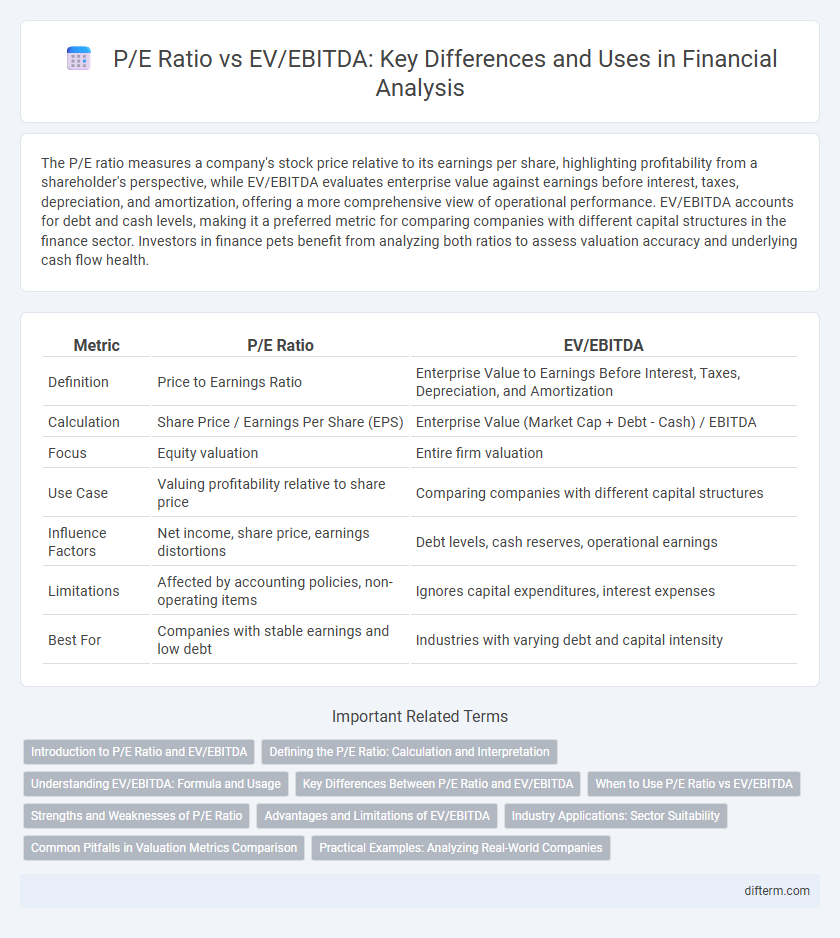
| Metric | P/E Ratio | EV/EBITDA |
|---|---|---|
| Definition | Price to Earnings Ratio | Enterprise Value to Earnings Before Interest, Taxes, Depreciation, and Amortization |
| Calculation | Share Price / Earnings Per Share (EPS) | Enterprise Value (Market Cap + Debt - Cash) / EBITDA |
| Focus | Equity valuation | Entire firm valuation |
| Use Case | Valuing profitability relative to share price | Comparing companies with different capital structures |
| Influence Factors | Net income, share price, earnings distortions | Debt levels, cash reserves, operational earnings |
| Limitations | Affected by accounting policies, non-operating items | Ignores capital expenditures, interest expenses |
| Best For | Companies with stable earnings and low debt | Industries with varying debt and capital intensity |
Introduction to P/E Ratio and EV/EBITDA
The Price-to-Earnings (P/E) ratio measures a company's current share price relative to its earnings per share, providing a straightforward valuation metric focused on profitability. Enterprise Value to EBITDA (EV/EBITDA) compares a company's total value, including debt and equity, to its earnings before interest, taxes, depreciation, and amortization, offering a more comprehensive view of operating performance. Both ratios are essential in financial analysis for assessing valuation but differ in scope, with EV/EBITDA accounting for capital structure and non-cash expenses.
Defining the P/E Ratio: Calculation and Interpretation
The P/E ratio, or price-to-earnings ratio, is calculated by dividing a company's current share price by its earnings per share (EPS), serving as a measure of the market's valuation relative to its profitability. This metric helps investors assess how much they are paying for each dollar of earnings, providing insight into whether a stock is overvalued or undervalued compared to peers. A higher P/E ratio typically indicates expectations of future growth, while a lower P/E may signal potential undervaluation or challenges in profitability.
Understanding EV/EBITDA: Formula and Usage
EV/EBITDA (Enterprise Value to Earnings Before Interest, Taxes, Depreciation, and Amortization) is calculated by dividing a company's enterprise value by its EBITDA, providing a clear metric to evaluate overall company valuation relative to operational earnings. This ratio is favored over P/E ratio for its ability to neutralize the effects of capital structure and non-cash accounting charges, offering a more accurate comparison across firms with different debt and tax profiles. Investors and analysts use EV/EBITDA to assess acquisition targets and industry peers, as it reflects true operational profitability and cash flow generation potential.
Key Differences Between P/E Ratio and EV/EBITDA
The P/E ratio measures a company's stock price relative to its earnings per share, reflecting equity value and profitability, whereas EV/EBITDA evaluates a firm's total enterprise value against its earnings before interest, taxes, depreciation, and amortization, capturing operational performance regardless of capital structure. P/E ratio is sensitive to accounting policies and capital structure, while EV/EBITDA provides a clearer comparison of companies with different debt levels and tax environments. Investors use EV/EBITDA to assess cash flow generation potential, whereas P/E ratio is more focused on net income attributable to shareholders.
When to Use P/E Ratio vs EV/EBITDA
The P/E ratio is best used for evaluating companies with stable earnings and significant net income, providing insight into stock price relative to earnings per share. EV/EBITDA is preferred for comparing firms with different capital structures and those with high depreciation or amortization expenses, as it reflects operating performance independent of financing and accounting decisions. Choosing between P/E and EV/EBITDA depends on industry norms, company maturity, and the need to assess profitability versus enterprise value.
Strengths and Weaknesses of P/E Ratio
The P/E ratio offers a straightforward measure of stock valuation by comparing share price to earnings, making it widely used for assessing profitability and market sentiment. However, it can be distorted by non-operating income, accounting practices, and does not account for debt or capital structure, limiting its effectiveness in comparing companies with different financial leverage. Unlike EV/EBITDA, P/E ratio overlooks enterprise value and operational cash flow, which reduces its accuracy in evaluating firms with varying capital expenditures or tax environments.
Advantages and Limitations of EV/EBITDA
EV/EBITDA offers advantages such as excluding non-cash expenses like depreciation and amortization, providing a clearer view of operational profitability. It is useful for comparing companies with different capital structures and tax situations by including debt and cash in enterprise value. However, EV/EBITDA may overlook significant capital expenditure requirements and variations in working capital, potentially distorting valuation for capital-intensive businesses.
Industry Applications: Sector Suitability
P/E ratio is predominantly suitable for evaluating companies with stable earnings and consistent dividend policies, commonly used in consumer goods and financial sectors where net income is a reliable performance measure. EV/EBITDA is favored in capital-intensive industries like utilities, telecommunications, and manufacturing because it accounts for debt levels and operational profitability, providing a clearer valuation perspective unaffected by capital structure differences. Sector-specific adoption of these ratios enables investors to benchmark companies effectively by aligning valuation metrics with industry characteristics and cash flow dynamics.
Common Pitfalls in Valuation Metrics Comparison
Comparing P/E ratio with EV/EBITDA often leads to misinterpretation due to differences in capital structure and earnings measurement; P/E focuses on net income per share, while EV/EBITDA accounts for enterprise value and operational profitability regardless of debt and tax variations. Ignoring these distinctions can result in undervaluing companies with high debt or significant non-cash charges. Proper valuation requires adjusting for leverage, depreciation, and amortization effects to ensure apples-to-apples comparison across firms.
Practical Examples: Analyzing Real-World Companies
The P/E ratio of Apple Inc. stood at approximately 28, reflecting investor expectations based on earnings per share, while its EV/EBITDA ratio was around 20, indicating the overall valuation including debt and cash flow. In contrast, Tesla's P/E ratio soared above 60, influenced by high growth expectations, yet its EV/EBITDA ratio remained near 25, highlighting differences in capital structure and profitability metrics. These practical examples illustrate how P/E focuses on net income relative to share price, whereas EV/EBITDA captures enterprise value against operating earnings, providing complementary perspectives for comprehensive company analysis.
P/E Ratio vs EV/EBITDA Infographic