Fundamental analysis evaluates a company's intrinsic value by examining financial statements, industry conditions, and economic factors to make long-term investment decisions. Technical analysis uses historical price data and chart patterns to predict short-term market movements and identify trading opportunities. Understanding the strengths and limitations of both approaches enhances portfolio management strategies and risk assessment.
Table of Comparison
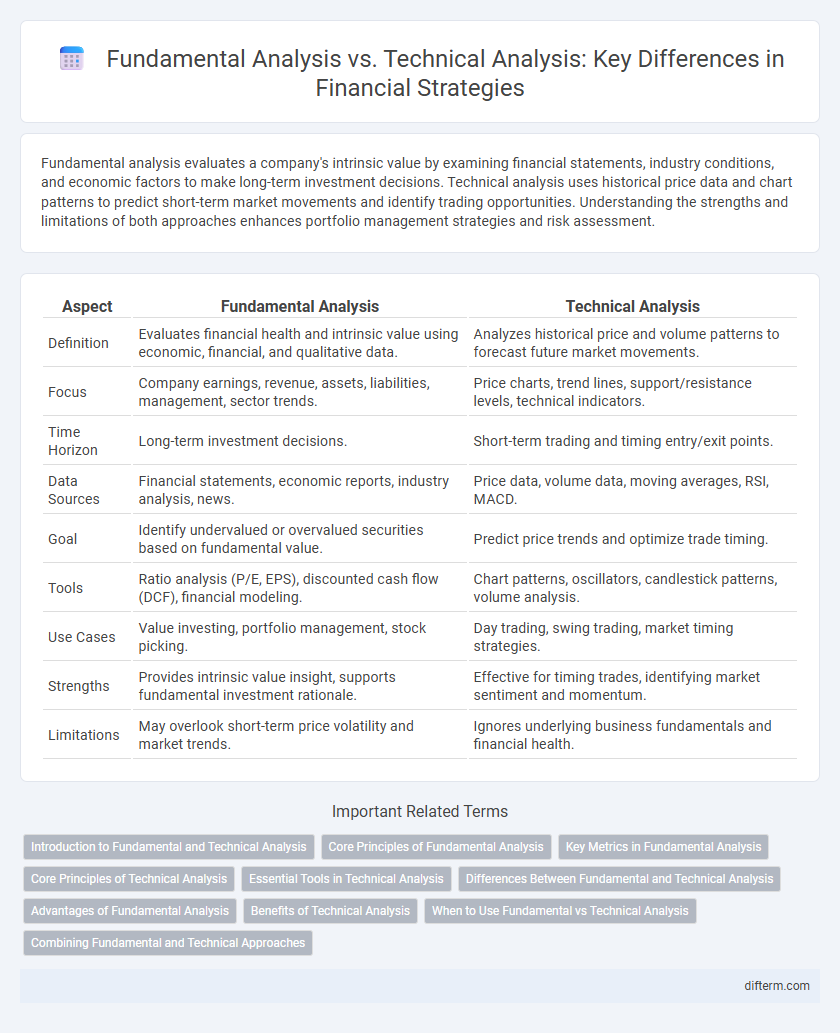
| Aspect | Fundamental Analysis | Technical Analysis |
|---|---|---|
| Definition | Evaluates financial health and intrinsic value using economic, financial, and qualitative data. | Analyzes historical price and volume patterns to forecast future market movements. |
| Focus | Company earnings, revenue, assets, liabilities, management, sector trends. | Price charts, trend lines, support/resistance levels, technical indicators. |
| Time Horizon | Long-term investment decisions. | Short-term trading and timing entry/exit points. |
| Data Sources | Financial statements, economic reports, industry analysis, news. | Price data, volume data, moving averages, RSI, MACD. |
| Goal | Identify undervalued or overvalued securities based on fundamental value. | Predict price trends and optimize trade timing. |
| Tools | Ratio analysis (P/E, EPS), discounted cash flow (DCF), financial modeling. | Chart patterns, oscillators, candlestick patterns, volume analysis. |
| Use Cases | Value investing, portfolio management, stock picking. | Day trading, swing trading, market timing strategies. |
| Strengths | Provides intrinsic value insight, supports fundamental investment rationale. | Effective for timing trades, identifying market sentiment and momentum. |
| Limitations | May overlook short-term price volatility and market trends. | Ignores underlying business fundamentals and financial health. |
Introduction to Fundamental and Technical Analysis
Fundamental analysis evaluates a company's intrinsic value by examining financial statements, economic indicators, and industry conditions to predict long-term stock performance. Technical analysis studies historical price movements, volume, and chart patterns to forecast short-term market trends and investor behavior. Both methods provide critical insights for making informed investment decisions in dynamic financial markets.
Core Principles of Fundamental Analysis
Fundamental analysis evaluates a company's intrinsic value by examining financial statements, economic indicators, and industry conditions to determine its long-term growth potential. Key components include earnings reports, revenue trends, profit margins, and balance sheet health, which collectively reveal a firm's financial stability and competitive advantage. This approach emphasizes understanding underlying business fundamentals rather than short-term price movements, guiding investment decisions based on the true economic value of assets.
Key Metrics in Fundamental Analysis
Key metrics in fundamental analysis include earnings per share (EPS), price-to-earnings (P/E) ratio, return on equity (ROE), and debt-to-equity ratio, which assess a company's profitability, valuation, and financial health. Analysts also evaluate revenue growth, cash flow, and dividend yield to determine long-term investment potential. These metrics provide insight into intrinsic value, contrasting with technical analysis that focuses on price patterns and market trends.
Core Principles of Technical Analysis
Technical analysis centers on examining historical price movements and trading volume to forecast future market behavior, relying heavily on chart patterns and technical indicators such as moving averages, Relative Strength Index (RSI), and Bollinger Bands. It assumes that all relevant information is already reflected in asset prices, emphasizing market psychology and trends over fundamental data like earnings or economic indicators. This method prioritizes timing entry and exit points by identifying support and resistance levels, trend directions, and momentum shifts to optimize trading decisions.
Essential Tools in Technical Analysis
Essential tools in technical analysis include chart patterns, moving averages, and oscillators such as the Relative Strength Index (RSI) and Moving Average Convergence Divergence (MACD). These tools allow traders to identify trends, momentum, and potential reversal points by analyzing price movements and trading volumes. By leveraging these indicators, technical analysts optimize entry and exit strategies to enhance investment decisions.
Differences Between Fundamental and Technical Analysis
Fundamental analysis evaluates a company's financial health, including earnings, revenue, and economic conditions, to estimate its intrinsic value and long-term growth potential. Technical analysis studies historical price movements, chart patterns, and trading volumes to predict short-term market trends and investor behavior. While fundamental analysis targets value investing based on economic indicators, technical analysis focuses on timing trades through market sentiment and price momentum.
Advantages of Fundamental Analysis
Fundamental analysis provides a comprehensive evaluation of a company's intrinsic value by examining financial statements, management quality, industry conditions, and economic factors, enabling long-term investment decisions. It helps investors identify undervalued stocks with strong growth potential and assess risk through detailed scrutiny of earnings, revenue, and cash flow trends. This method supports portfolio diversification and aligns investment strategies with macroeconomic indicators and sector performance.
Benefits of Technical Analysis
Technical analysis offers real-time insights by analyzing historical price patterns and market trends, enabling traders to identify entry and exit points with enhanced precision. It provides objective, quantifiable data through charts and indicators, facilitating quicker decision-making compared to fundamental analysis. This method is especially beneficial for short-term trading strategies and volatile markets where timely reactions are critical.
When to Use Fundamental vs Technical Analysis
Fundamental analysis is most effective for long-term investment decisions, focusing on evaluating a company's intrinsic value through financial statements, economic indicators, and industry trends. Technical analysis is ideal for short-term trading strategies, relying on price patterns, volume, and momentum indicators to predict market movements. Investors might use fundamental analysis to select solid stocks and technical analysis to time entry and exit points.
Combining Fundamental and Technical Approaches
Integrating fundamental analysis with technical analysis enhances investment decision-making by combining intrinsic value assessment with price trend evaluation. Fundamental analysis identifies undervalued assets through financial metrics such as P/E ratios and earnings growth, while technical analysis pinpoints optimal entry and exit points using price patterns and volume indicators. This combined approach improves portfolio performance by leveraging comprehensive market insights and timing strategies.
Fundamental Analysis vs Technical Analysis Infographic