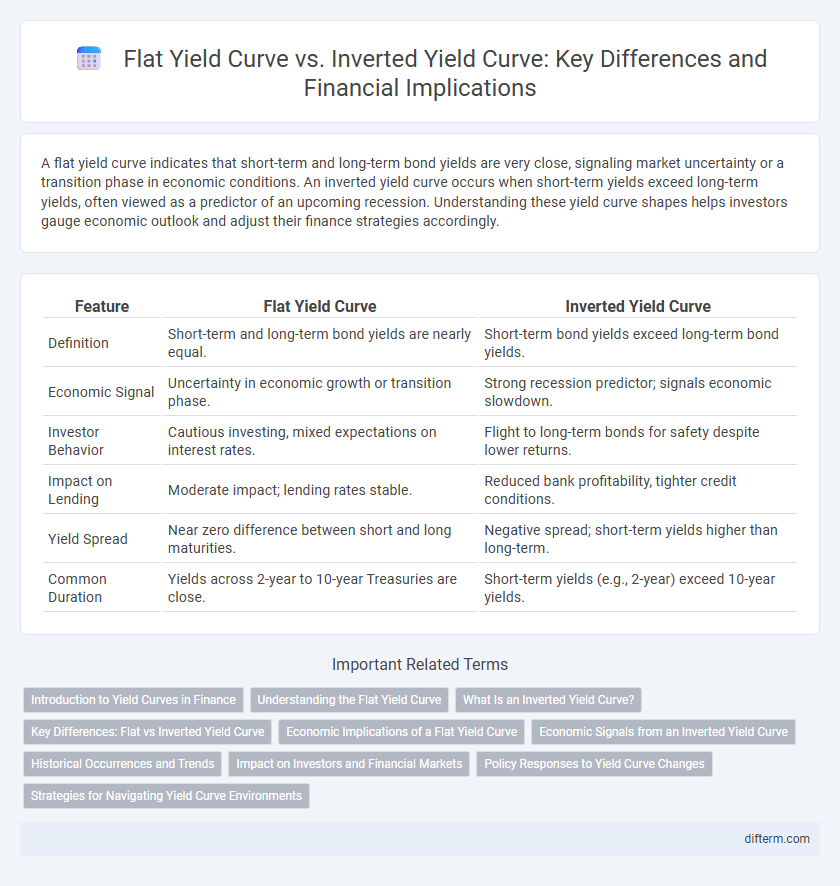
A flat yield curve indicates that short-term and long-term bond yields are very close, signaling market uncertainty or a transition phase in economic conditions. An inverted yield curve occurs when short-term yields exceed long-term yields, often viewed as a predictor of an upcoming recession. Understanding these yield curve shapes helps investors gauge economic outlook and adjust their finance strategies accordingly.
Table of Comparison
| Feature | Flat Yield Curve | Inverted Yield Curve |
|---|---|---|
| Definition | Short-term and long-term bond yields are nearly equal. | Short-term bond yields exceed long-term bond yields. |
| Economic Signal | Uncertainty in economic growth or transition phase. | Strong recession predictor; signals economic slowdown. |
| Investor Behavior | Cautious investing, mixed expectations on interest rates. | Flight to long-term bonds for safety despite lower returns. |
| Impact on Lending | Moderate impact; lending rates stable. | Reduced bank profitability, tighter credit conditions. |
| Yield Spread | Near zero difference between short and long maturities. | Negative spread; short-term yields higher than long-term. |
| Common Duration | Yields across 2-year to 10-year Treasuries are close. | Short-term yields (e.g., 2-year) exceed 10-year yields. |
Introduction to Yield Curves in Finance
Yield curves represent the relationship between interest rates and the maturity of debt securities, typically government bonds, indicating market expectations for future interest rates and economic activity. A flat yield curve occurs when short-term and long-term interest rates are very close, signaling uncertainty or transition in economic growth. In contrast, an inverted yield curve features higher short-term rates compared to long-term rates, often viewed as a predictor of an upcoming recession.
Understanding the Flat Yield Curve
A flat yield curve indicates that short-term and long-term interest rates are nearly equal, reflecting investor uncertainty about future economic growth. This pattern often signals a transition period in the economy, where expectations for inflation and interest rate changes are balanced. Investors may interpret a flat yield curve as a warning of potential economic slowdown or a shift in monetary policy.
What Is an Inverted Yield Curve?
An inverted yield curve occurs when long-term interest rates fall below short-term rates, signaling investor pessimism about future economic growth. This phenomenon often precedes economic recessions, as it reflects expectations of declining inflation and interest rates. Investors interpret an inverted yield curve as a warning sign for potential downturns in the financial markets.
Key Differences: Flat vs Inverted Yield Curve
A flat yield curve indicates that short-term and long-term interest rates are nearly equal, reflecting market uncertainty about future economic growth. An inverted yield curve occurs when short-term rates exceed long-term rates, often signaling an upcoming recession or economic downturn. Key differences include investor sentiment, with flat curves suggesting transition phases and inverted curves indicating heightened risk aversion and expectations of declining interest rates.
Economic Implications of a Flat Yield Curve
A flat yield curve often signals investor uncertainty about future economic growth, reflecting expectations of slower expansion or a transition phase in the business cycle. It can indicate that short-term and long-term interest rates are aligning due to cautious monetary policy or subdued inflation forecasts, which may lead to reduced lending and investment activities. Historically, a flat yield curve has preceded periods of economic slowdown or recession, suggesting heightened market concerns about sustained economic momentum.
Economic Signals from an Inverted Yield Curve
An inverted yield curve occurs when long-term interest rates fall below short-term rates, signaling market expectations of an economic slowdown or recession. Historically, this curve inversion has preceded several U.S. recessions, making it a crucial economic indicator for investors and policymakers. The inversion reflects declining confidence in future economic growth, often prompting shifts in investment strategies and monetary policy adjustments.
Historical Occurrences and Trends
Historical occurrences of flat yield curves often signal economic slowdown periods, with notable examples during the early 2000s and post-2008 financial crisis, reflecting investor uncertainty and lower long-term growth expectations. Inverted yield curves have a strong track record as recession predictors, famously preceding the US recessions of 2007-2009 and 2020, driven by a surge in demand for long-term bonds amid declining interest rates. Trends indicate increasing volatility in yield curve shapes due to global economic shifts, monetary policy changes, and fluctuating inflation expectations impacting market sentiment.
Impact on Investors and Financial Markets
A flat yield curve signals uncertainty in economic growth, causing investors to hesitate between short and long-term bonds, often leading to reduced market liquidity and cautious portfolio adjustments. An inverted yield curve, where short-term rates exceed long-term rates, commonly predicts recessions and triggers risk-off behavior, prompting a shift toward safer assets and increased volatility in equity markets. Financial institutions may tighten lending standards during an inverted curve period, slowing credit flow and impacting corporate investment decisions.
Policy Responses to Yield Curve Changes
Policy responses to flat yield curves often involve central banks maintaining or cautiously adjusting interest rates to stimulate economic growth without triggering inflation. In contrast, inverted yield curves typically prompt more aggressive monetary easing to prevent recession risks, including lowering short-term rates and implementing quantitative easing measures. Fiscal authorities may also increase government spending or tax cuts in response to inverted curves to boost demand and confidence in financial markets.
Strategies for Navigating Yield Curve Environments
Flat yield curves signal investor uncertainty and often prompt strategies favoring short-term bonds and flexible asset allocations to mitigate risk. Inverted yield curves, historically indicating potential recessions, encourage investors to prioritize long-duration bonds and defensive sectors such as utilities and consumer staples. Portfolio diversification and vigilant monitoring of economic indicators remain essential for adapting to shifting yield curve conditions.
Flat yield curve vs Inverted yield curve Infographic