The Sharpe ratio measures risk-adjusted return by considering total portfolio volatility, making it ideal for evaluating overall investment performance. The Treynor ratio, however, focuses on systematic risk by using beta, reflecting the returns earned per unit of market risk. Comparing these ratios helps investors determine whether portfolio returns are driven by market exposure or total risk management.
Table of Comparison
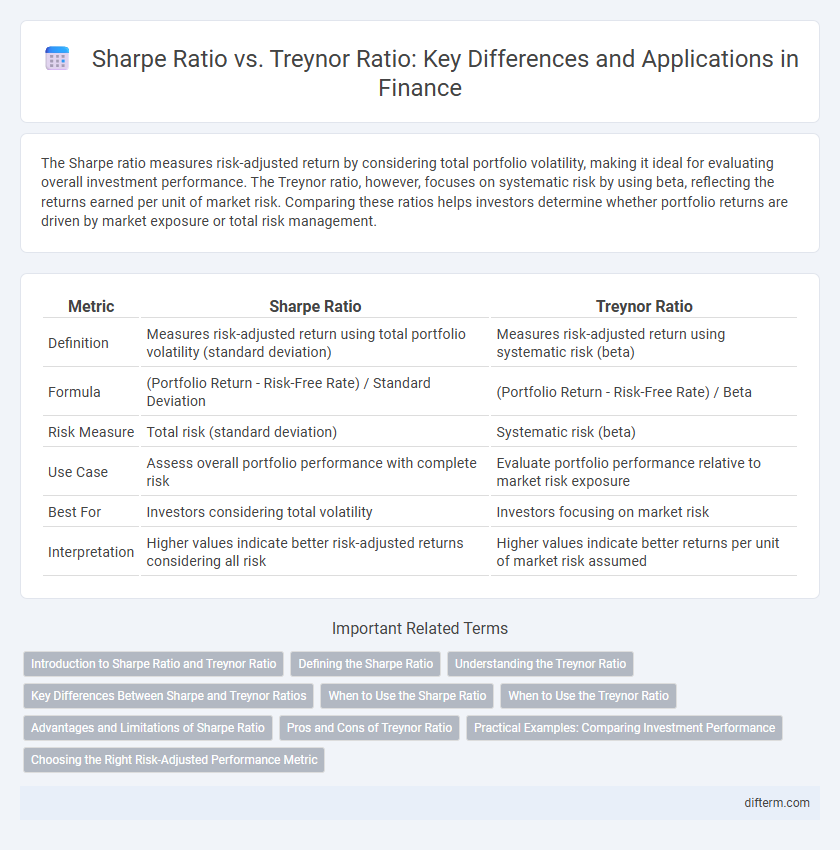
| Metric | Sharpe Ratio | Treynor Ratio |
|---|---|---|
| Definition | Measures risk-adjusted return using total portfolio volatility (standard deviation) | Measures risk-adjusted return using systematic risk (beta) |
| Formula | (Portfolio Return - Risk-Free Rate) / Standard Deviation | (Portfolio Return - Risk-Free Rate) / Beta |
| Risk Measure | Total risk (standard deviation) | Systematic risk (beta) |
| Use Case | Assess overall portfolio performance with complete risk | Evaluate portfolio performance relative to market risk exposure |
| Best For | Investors considering total volatility | Investors focusing on market risk |
| Interpretation | Higher values indicate better risk-adjusted returns considering all risk | Higher values indicate better returns per unit of market risk assumed |
Introduction to Sharpe Ratio and Treynor Ratio
The Sharpe ratio measures risk-adjusted return by evaluating the excess return of an investment per unit of total risk, quantified by standard deviation. The Treynor ratio assesses returns relative to systematic risk, using beta to capture market exposure. Both metrics help investors gauge portfolio performance but differ in their risk measurement approach, targeting total versus market risk.
Defining the Sharpe Ratio
The Sharpe Ratio measures the risk-adjusted return of an investment by calculating the excess return above the risk-free rate per unit of total volatility, represented by standard deviation. It helps investors understand how well the return of an asset compensates for the risk taken, making it crucial for comparing portfolios with different risk profiles. Unlike the Treynor Ratio, which uses systematic risk (beta), the Sharpe Ratio incorporates total risk, providing a comprehensive measure of investment performance.
Understanding the Treynor Ratio
The Treynor ratio measures the excess return per unit of systematic risk, utilizing beta to assess portfolio performance against market volatility. Unlike the Sharpe ratio, which considers total risk via standard deviation, the Treynor ratio isolates market risk, making it ideal for well-diversified portfolios. Investors rely on the Treynor ratio to evaluate how effectively a portfolio compensates for market risk, guiding asset allocation and risk management decisions.
Key Differences Between Sharpe and Treynor Ratios
The Sharpe ratio evaluates risk-adjusted returns by measuring excess return per unit of total risk using standard deviation, while the Treynor ratio assesses returns relative to systematic risk using beta. Unlike the Sharpe ratio, which accounts for total volatility, the Treynor ratio isolates market risk, making it suitable for diversified portfolios. Investors use the Sharpe ratio for overall risk assessment and the Treynor ratio to evaluate performance against market risk exposure.
When to Use the Sharpe Ratio
Use the Sharpe ratio when evaluating portfolios or investments based on total risk, as it measures risk-adjusted returns by considering standard deviation of returns. It is most effective for comparing portfolios diversified across multiple assets, where total volatility impacts investor decisions. The Sharpe ratio is preferable when the risk-free rate is stable and the investor seeks to understand performance relative to overall market fluctuations.
When to Use the Treynor Ratio
The Treynor ratio is most effective for evaluating portfolios within well-diversified portfolios where systematic risk is the primary concern, as it measures returns in relation to beta rather than total volatility. Investors relying on market risk rather than total risk prefer the Treynor ratio to assess performance relative to the expected return from market exposure. It is particularly useful when comparing portfolios or funds exposed to different levels of systematic risk in a consistent benchmark context.
Advantages and Limitations of Sharpe Ratio
The Sharpe ratio measures risk-adjusted return by accounting for total portfolio volatility, making it useful for evaluating diversified investments with varying risk levels. It advantages include simplicity and applicability to any portfolio regardless of its market exposure. However, its limitation lies in treating all volatility as risk, which can misrepresent the performance of assets with non-market risks, unlike the Treynor ratio that isolates systematic risk.
Pros and Cons of Treynor Ratio
The Treynor Ratio measures risk-adjusted returns by evaluating portfolio performance relative to systematic risk, making it valuable for investors focused on market risk exposure. A key advantage is its use of beta, which accounts for the sensitivity of returns to market movements, offering a clearer insight for diversified portfolios. However, its limitation lies in neglecting unsystematic risk, which can lead to misleading assessments for portfolios that are not fully diversified.
Practical Examples: Comparing Investment Performance
The Sharpe ratio evaluates investment performance by measuring excess return per unit of total risk, making it ideal for portfolios with diversified assets. The Treynor ratio, on the other hand, assesses returns relative to systematic risk (beta), suited for portfolios integrated within a broader market context. For example, a fund with a Sharpe ratio of 1.2 outperforms another with 0.8 on a risk-adjusted basis, while a Treynor ratio of 0.15 versus 0.10 indicates better compensation for market risk.
Choosing the Right Risk-Adjusted Performance Metric
Selecting the appropriate risk-adjusted performance metric depends on the investor's focus: the Sharpe ratio evaluates returns per unit of total risk by considering portfolio standard deviation, while the Treynor ratio measures returns relative to systematic risk using beta. For portfolios well-diversified against unsystematic risk, the Treynor ratio offers a precise assessment of market-related risk exposure, whereas the Sharpe ratio provides a broader view by accounting for total volatility. Understanding the underlying risk factors each ratio addresses ensures more informed, context-specific investment decisions.
Sharpe ratio vs Treynor ratio Infographic