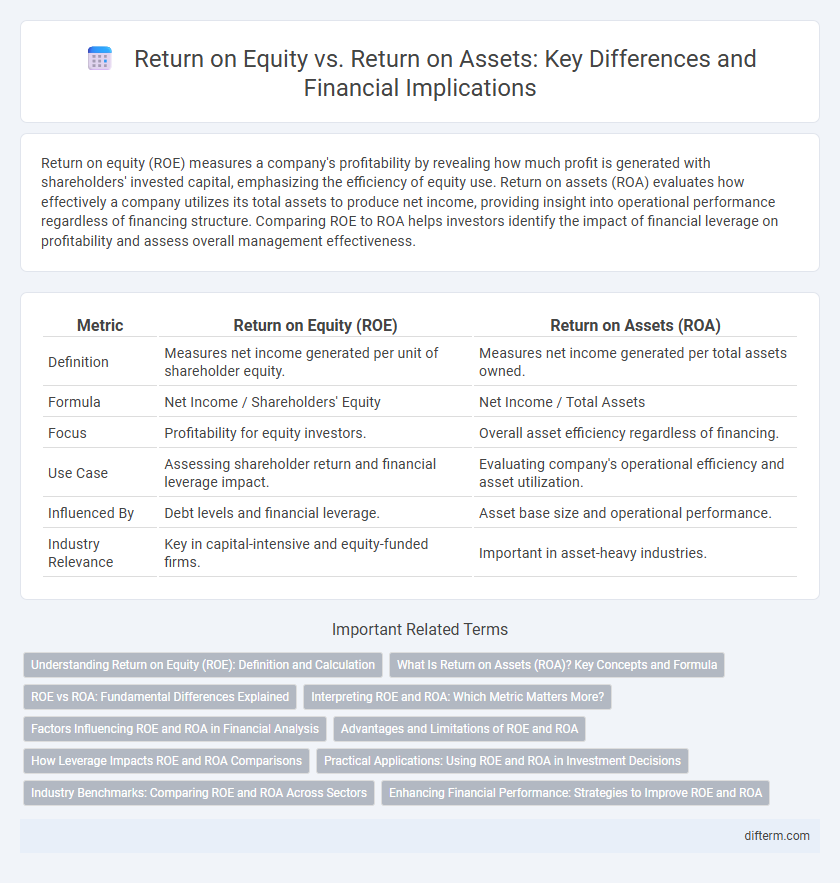
Return on equity (ROE) measures a company's profitability by revealing how much profit is generated with shareholders' invested capital, emphasizing the efficiency of equity use. Return on assets (ROA) evaluates how effectively a company utilizes its total assets to produce net income, providing insight into operational performance regardless of financing structure. Comparing ROE to ROA helps investors identify the impact of financial leverage on profitability and assess overall management effectiveness.
Table of Comparison
| Metric | Return on Equity (ROE) | Return on Assets (ROA) |
|---|---|---|
| Definition | Measures net income generated per unit of shareholder equity. | Measures net income generated per total assets owned. |
| Formula | Net Income / Shareholders' Equity | Net Income / Total Assets |
| Focus | Profitability for equity investors. | Overall asset efficiency regardless of financing. |
| Use Case | Assessing shareholder return and financial leverage impact. | Evaluating company's operational efficiency and asset utilization. |
| Influenced By | Debt levels and financial leverage. | Asset base size and operational performance. |
| Industry Relevance | Key in capital-intensive and equity-funded firms. | Important in asset-heavy industries. |
Understanding Return on Equity (ROE): Definition and Calculation
Return on Equity (ROE) measures a company's profitability by revealing how much net income is generated as a percentage of shareholders' equity, reflecting the efficiency in using equity investments to produce earnings. Calculated by dividing net income by average shareholders' equity, ROE provides crucial insight into financial performance, helping investors compare profitability across companies regardless of size. Unlike Return on Assets (ROA), which accounts for total asset utilization, ROE specifically highlights returns generated from the equity base, emphasizing the company's ability to generate profit from shareholder investments.
What Is Return on Assets (ROA)? Key Concepts and Formula
Return on Assets (ROA) measures a company's profitability relative to its total assets, indicating how efficiently management uses assets to generate earnings. The formula for ROA is Net Income divided by Total Assets, reflecting the percentage of profit earned from each dollar of assets. Unlike Return on Equity (ROE), which focuses on shareholders' equity, ROA provides insight into asset utilization regardless of the company's financing structure.
ROE vs ROA: Fundamental Differences Explained
Return on Equity (ROE) measures a company's profitability by revealing how much net income is generated from shareholders' equity, highlighting efficiency in using invested capital. Return on Assets (ROA) indicates how effectively a company utilizes its total assets to produce net income, reflecting operational performance. The fundamental difference lies in ROE focusing on equity holders' returns while ROA assesses overall asset efficiency, with ROE often higher due to leverage effects.
Interpreting ROE and ROA: Which Metric Matters More?
Return on Equity (ROE) measures a company's profitability relative to shareholder equity, indicating how effectively management uses invested capital to generate profits. Return on Assets (ROA) assesses a firm's ability to generate earnings from its total assets, reflecting operational efficiency regardless of financing structure. Investors prioritize ROE for insights on equity returns, while ROA offers a clearer picture of overall asset utilization; the choice between the two depends on the company's leverage and industry context.
Factors Influencing ROE and ROA in Financial Analysis
Return on equity (ROE) is primarily influenced by a company's net profit margin, asset turnover, and financial leverage, reflecting how effectively equity capital generates profits. Return on assets (ROA) depends on asset efficiency and profitability, measuring the ability to convert assets into net income without considering debt structure. Variations in operating efficiency, debt levels, and industry-specific capital intensity significantly affect both ROE and ROA, making these ratios critical for comprehensive financial analysis.
Advantages and Limitations of ROE and ROA
Return on equity (ROE) measures profitability by indicating how effectively a company generates profit from shareholders' equity, offering insights into financial leverage and investor returns, but it can be skewed by high debt levels and share buybacks. Return on assets (ROA) evaluates how efficiently a company uses its total assets to produce earnings, providing a broader view of operational efficiency independent of financing structure, though it may understate performance for firms with significant leverage. ROE excels in assessing shareholder value creation, while ROA is advantageous for comparing companies across industries with varying capital intensities.
How Leverage Impacts ROE and ROA Comparisons
Leverage amplifies Return on Equity (ROE) by increasing the proportion of debt in a company's capital structure, which can boost net income attributable to shareholders. Return on Assets (ROA) remains less affected because it measures profitability relative to total assets, not equity, and higher leverage increases interest expenses, potentially lowering ROA. Comparing ROE and ROA reveals how financial leverage influences profitability assessments, with higher leverage generally widening the gap between ROE and ROA.
Practical Applications: Using ROE and ROA in Investment Decisions
Return on equity (ROE) measures a company's profitability relative to shareholders' equity, making it crucial for evaluating how effectively management generates returns on invested capital. Return on assets (ROA) assesses a company's ability to convert assets into net income, offering insights into operational efficiency independent of financing structure. Investors use ROE to analyze growth potential and shareholder value, while ROA helps identify asset utilization efficiency, both guiding investment decisions based on financial performance metrics.
Industry Benchmarks: Comparing ROE and ROA Across Sectors
Return on Equity (ROE) and Return on Assets (ROA) vary significantly across industries due to differing capital structures and asset intensity. High capital sectors like utilities often show lower ROA but higher ROE, reflecting leverage effects, while asset-light industries such as technology typically report higher ROA and moderate ROE. Benchmarking ROE and ROA against industry peers provides critical insight into operational efficiency and financial leverage within each sector.
Enhancing Financial Performance: Strategies to Improve ROE and ROA
Enhancing financial performance requires targeted strategies to improve both Return on Equity (ROE) and Return on Assets (ROA), such as optimizing asset utilization to boost ROA and implementing efficient capital structuring to elevate ROE. Companies can increase ROA by investing in high-yield assets and reducing operational inefficiencies, while ROE improvement relies on maximizing net income through cost control and leveraging debt effectively. Monitoring key financial ratios and aligning investment decisions with profitability goals ensures balanced growth and sustained shareholder value.
Return on equity vs Return on assets Infographic