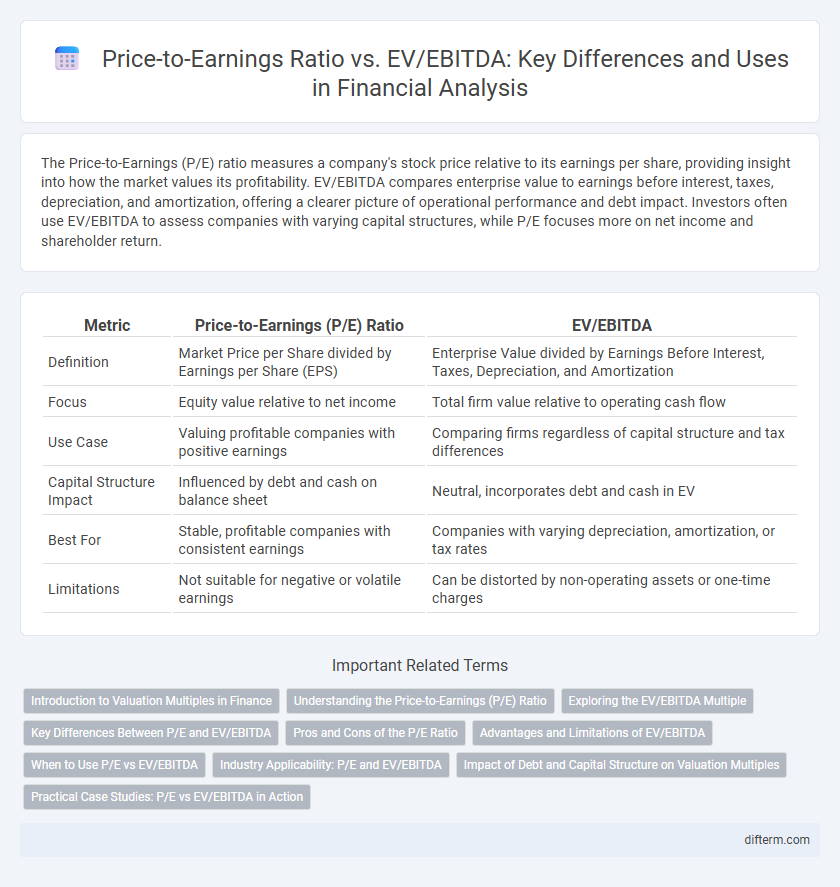
The Price-to-Earnings (P/E) ratio measures a company's stock price relative to its earnings per share, providing insight into how the market values its profitability. EV/EBITDA compares enterprise value to earnings before interest, taxes, depreciation, and amortization, offering a clearer picture of operational performance and debt impact. Investors often use EV/EBITDA to assess companies with varying capital structures, while P/E focuses more on net income and shareholder return.
Table of Comparison
| Metric | Price-to-Earnings (P/E) Ratio | EV/EBITDA |
|---|---|---|
| Definition | Market Price per Share divided by Earnings per Share (EPS) | Enterprise Value divided by Earnings Before Interest, Taxes, Depreciation, and Amortization |
| Focus | Equity value relative to net income | Total firm value relative to operating cash flow |
| Use Case | Valuing profitable companies with positive earnings | Comparing firms regardless of capital structure and tax differences |
| Capital Structure Impact | Influenced by debt and cash on balance sheet | Neutral, incorporates debt and cash in EV |
| Best For | Stable, profitable companies with consistent earnings | Companies with varying depreciation, amortization, or tax rates |
| Limitations | Not suitable for negative or volatile earnings | Can be distorted by non-operating assets or one-time charges |
Introduction to Valuation Multiples in Finance
Price-to-Earnings (P/E) Ratio measures a company's current share price relative to its earnings per share, serving as a key indicator of market expectations and profitability. EV/EBITDA (Enterprise Value to Earnings Before Interest, Taxes, Depreciation, and Amortization) evaluates a firm's total valuation relative to its operating cash flow, offering a comprehensive view of financial performance excluding capital structure and non-cash items. Both multiples are essential in comparative valuation, enabling investors to assess relative value, growth potential, and risk across different companies and industries.
Understanding the Price-to-Earnings (P/E) Ratio
The Price-to-Earnings (P/E) ratio measures a company's current share price relative to its earnings per share, providing investors insight into market expectations for future growth. A high P/E ratio often indicates that the stock is overvalued or investors anticipate high growth rates, while a low P/E may suggest undervaluation or potential earnings challenges. Comparing the P/E ratio with EV/EBITDA allows for a more comprehensive valuation by incorporating debt and cash levels alongside operational profitability.
Exploring the EV/EBITDA Multiple
EV/EBITDA multiple offers a more comprehensive valuation metric than the Price-to-Earnings (P/E) ratio by incorporating enterprise value, which includes debt and cash levels, providing a clearer assessment of a company's total value relative to earnings before interest, taxes, depreciation, and amortization. This multiple is especially valuable in capital-intensive industries where depreciation and amortization distort net earnings, enabling investors to compare companies with varying capital structures more accurately. Unlike the P/E ratio, EV/EBITDA neutralizes the effects of differing tax rates and financing decisions, making it a preferred tool for cross-sector financial analysis and investment decision-making.
Key Differences Between P/E and EV/EBITDA
Price-to-Earnings (P/E) ratio measures a company's stock price relative to its net earnings, reflecting investor expectations and profitability. EV/EBITDA compares enterprise value to earnings before interest, taxes, depreciation, and amortization, providing a clearer picture of operational performance by excluding capital structure and non-cash expenses. P/E is influenced by capital structure and accounting policies, while EV/EBITDA offers a more standardized valuation by considering debt and cash levels.
Pros and Cons of the P/E Ratio
The Price-to-Earnings (P/E) ratio is widely used for its simplicity and direct reflection of earnings relative to stock price, making it easy to interpret for valuation comparisons across companies. However, it can be misleading in cases of negative or volatile earnings and does not account for differences in capital structure or tax rates, limiting its effectiveness for firms with high debt or varying financial leverage. Unlike EV/EBITDA, the P/E ratio ignores enterprise value and operating cash flows, which can obscure true company valuation in capital-intensive industries.
Advantages and Limitations of EV/EBITDA
EV/EBITDA provides a clearer picture of a company's operational profitability by excluding the effects of capital structure, taxes, and non-cash expenses, making it useful for comparing companies across industries. It is advantageous for valuing firms with different debt levels since it reflects enterprise value rather than just equity value. However, EV/EBITDA can overlook important factors like capital expenditures, working capital changes, and earnings quality, which may limit its effectiveness in assessing long-term financial health.
When to Use P/E vs EV/EBITDA
Price-to-Earnings (P/E) ratio is most effective for valuing companies with stable earnings and substantial net income, commonly used in industries like consumer goods and finance. EV/EBITDA is preferred for firms with significant debt or varying capital structures, such as utilities and telecommunications, as it accounts for enterprise value and operating profitability. Choosing between P/E and EV/EBITDA depends on the company's capital intensity, earnings volatility, and whether analysts need to assess ownership or overall enterprise value.
Industry Applicability: P/E and EV/EBITDA
The Price-to-Earnings (P/E) ratio is widely used in industries with stable earnings and capital structures, such as consumer goods and technology, where net income provides a clear profitability measure. EV/EBITDA is preferred in capital-intensive sectors like utilities and telecommunications because it accounts for debt levels and cash flow generation, offering a more comprehensive valuation by including enterprise value and operating profitability. Industry applicability of these ratios varies, with analysts selecting P/E for earnings-focused assessments and EV/EBITDA for evaluating firms with significant depreciation and amortization expenses.
Impact of Debt and Capital Structure on Valuation Multiples
The Price-to-Earnings (P/E) ratio primarily reflects a company's net income relative to its market equity, making it sensitive to capital structure and interest expenses from debt. In contrast, the EV/EBITDA multiple incorporates enterprise value, including debt and equity, thus providing a valuation less affected by leverage and tax differences. High debt levels can distort P/E ratios by reducing net income through interest charges, whereas EV/EBITDA offers a clearer picture of operational profitability independent of financing decisions.
Practical Case Studies: P/E vs EV/EBITDA in Action
Price-to-Earnings (P/E) ratio and EV/EBITDA are essential valuation metrics used in practical case studies to assess company performance across industries. P/E ratio focuses on market price relative to net earnings, highlighting profitability and investor sentiment, while EV/EBITDA accounts for enterprise value and operating cash flow, offering a clearer picture of operational efficiency unaffected by capital structure. Real-world applications show EV/EBITDA is preferred for capital-intensive firms, whereas P/E is often favored for companies with stable earnings and low debt.
Price-to-Earnings Ratio vs EV/EBITDA Infographic