The yield curve illustrates the relationship between interest rates and different bond maturities, highlighting market expectations of future interest rates and economic activity. Yield spread measures the difference in yields between two bonds, often used to assess risk premium or credit quality differences. Understanding the distinction between yield curve and yield spread is crucial for investors evaluating monetary policy impacts and economic forecasts.
Table of Comparison
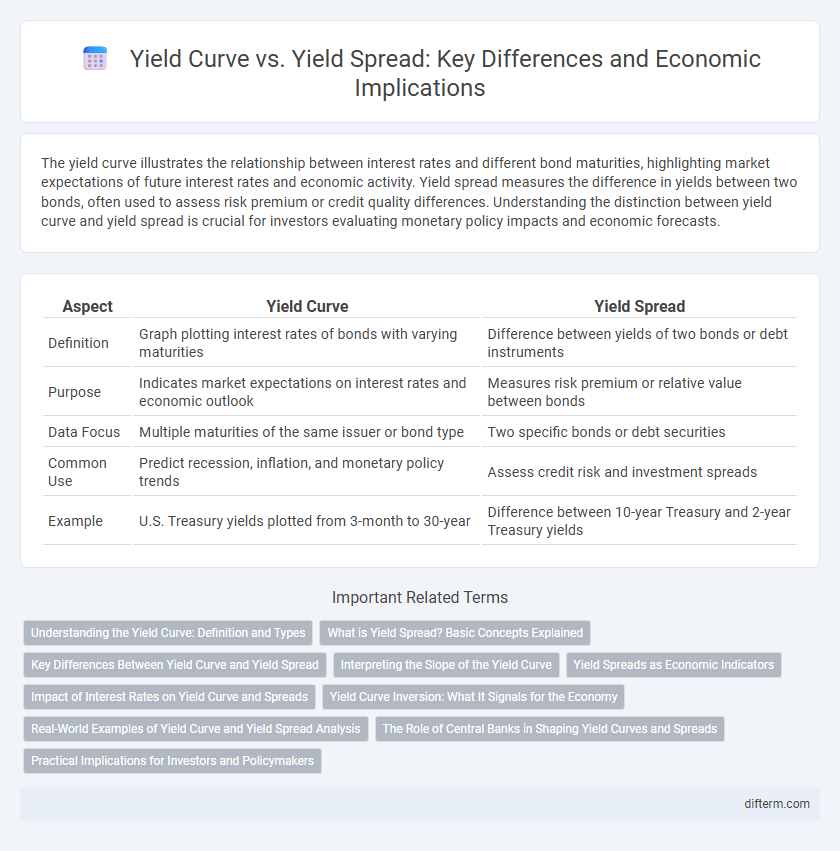
| Aspect | Yield Curve | Yield Spread |
|---|---|---|
| Definition | Graph plotting interest rates of bonds with varying maturities | Difference between yields of two bonds or debt instruments |
| Purpose | Indicates market expectations on interest rates and economic outlook | Measures risk premium or relative value between bonds |
| Data Focus | Multiple maturities of the same issuer or bond type | Two specific bonds or debt securities |
| Common Use | Predict recession, inflation, and monetary policy trends | Assess credit risk and investment spreads |
| Example | U.S. Treasury yields plotted from 3-month to 30-year | Difference between 10-year Treasury and 2-year Treasury yields |
Understanding the Yield Curve: Definition and Types
The yield curve represents the relationship between interest rates and the maturities of debt securities, primarily government bonds, reflecting investor expectations about future interest rates and economic activity. Common types include the normal upward-sloping curve, inverted yield curve signaling potential recession, and flat yield curve indicating economic uncertainty. By analyzing different segments of the yield curve, such as short-term and long-term yields, investors gain insights into market sentiment and potential economic trends.
What is Yield Spread? Basic Concepts Explained
Yield spread represents the difference in yields between two different debt instruments, typically government bonds with varying maturities or credit qualities. It is a critical indicator for assessing risk premiums, investor sentiment, and economic outlook by comparing short-term and long-term interest rates. Understanding yield spread helps investors and policymakers predict changes in economic growth, inflation expectations, and potential shifts in monetary policy.
Key Differences Between Yield Curve and Yield Spread
The yield curve graphically represents the relationship between interest rates and different bond maturities, typically showing short-term to long-term Treasury yields. Yield spread measures the difference between yields on two different bonds, often between government and corporate bonds or different credit qualities. Key differences lie in the yield curve providing a holistic view of market interest rate expectations across maturities, while yield spread offers a comparative measure of risk or credit quality between specific securities.
Interpreting the Slope of the Yield Curve
The slope of the yield curve serves as a crucial indicator of economic expectations by illustrating the difference between long-term and short-term bond yields, reflecting investor sentiment on future growth and inflation. A steep yield curve typically signals robust economic growth prospects and rising inflation expectations, while a flat or inverted curve often predicts economic slowdown or recession. Understanding the yield spread between different maturities helps investors and policymakers assess credit risk, liquidity conditions, and potential shifts in monetary policy.
Yield Spreads as Economic Indicators
Yield spreads, which measure the difference between yields on bonds of varying maturities or credit qualities, serve as crucial economic indicators by reflecting market expectations about future interest rates, inflation, and economic growth. A widening yield spread often signals increased credit risk or economic uncertainty, while a narrowing spread can indicate investor confidence and economic stability. Monitoring yield spreads helps analysts predict recessions, as inverted spreads--where short-term yields exceed long-term yields--have historically preceded economic downturns.
Impact of Interest Rates on Yield Curve and Spreads
Interest rate fluctuations directly influence the yield curve's shape by altering long-term and short-term bond yields, causing the curve to steepen or invert under varying economic conditions. Yield spreads, representing the difference between yields on bonds with different maturities or credit qualities, expand or contract as interest rate changes affect risk premiums and market expectations. Analyzing these dynamics helps predict economic outlooks, with widening spreads often signaling increased credit risk and potential economic slowdown.
Yield Curve Inversion: What It Signals for the Economy
A yield curve inversion occurs when long-term bond yields fall below short-term yields, signaling investor pessimism about future economic growth. Historically, an inverted yield curve has been a reliable predictor of upcoming recessions, reflecting expectations of declining interest rates due to economic weakness. Monitoring the shape of the yield curve provides critical insights into market sentiment and potential shifts in monetary policy.
Real-World Examples of Yield Curve and Yield Spread Analysis
The U.S. Treasury yield curve in 2022 inverted as short-term rates rose above long-term bonds, signaling market concerns about potential recession and slowing economic growth. Yield spread analysis between the 10-year and 2-year Treasury notes revealed a negative spread, historically associated with tightening credit conditions and investor risk aversion. In contrast, during the post-2008 recovery, a steepening yield curve and widening yield spreads indicated improving economic confidence and expectations of higher future inflation.
The Role of Central Banks in Shaping Yield Curves and Spreads
Central banks influence yield curves and yield spreads primarily through monetary policy tools such as interest rate adjustments and quantitative easing programs. By setting short-term policy rates and purchasing government bonds, central banks impact longer-term interest rates, shaping the slope and curvature of the yield curve. These interventions modify the risk perception and liquidity conditions in bond markets, directly affecting the yield spread between different maturities and credit qualities.
Practical Implications for Investors and Policymakers
Yield curve analysis provides investors and policymakers with critical insights into future interest rate movements and economic expectations by illustrating the relationship between bond yields and maturities. Yield spread, the difference between yields on bonds of varying credit quality or maturities, serves as a practical indicator of credit risk and market sentiment, guiding investment decisions and monetary policy adjustments. Understanding the dynamics between yield curves and yield spreads enhances risk assessment and strategic planning in financial markets.
Yield Curve vs Yield Spread Infographic