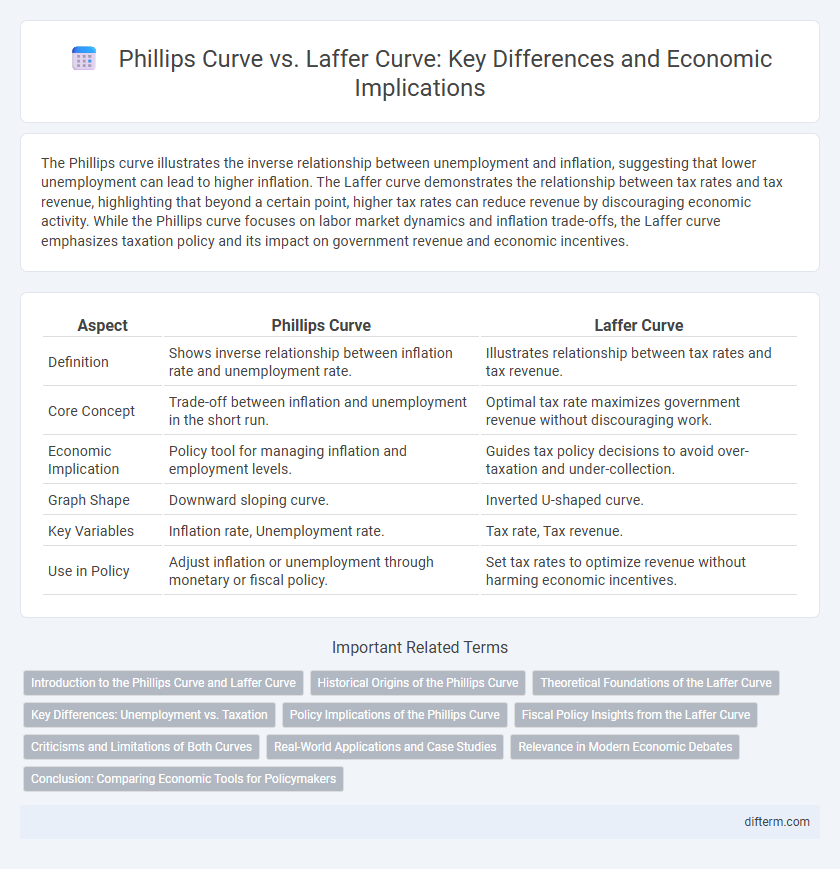
The Phillips curve illustrates the inverse relationship between unemployment and inflation, suggesting that lower unemployment can lead to higher inflation. The Laffer curve demonstrates the relationship between tax rates and tax revenue, highlighting that beyond a certain point, higher tax rates can reduce revenue by discouraging economic activity. While the Phillips curve focuses on labor market dynamics and inflation trade-offs, the Laffer curve emphasizes taxation policy and its impact on government revenue and economic incentives.
Table of Comparison
| Aspect | Phillips Curve | Laffer Curve |
|---|---|---|
| Definition | Shows inverse relationship between inflation rate and unemployment rate. | Illustrates relationship between tax rates and tax revenue. |
| Core Concept | Trade-off between inflation and unemployment in the short run. | Optimal tax rate maximizes government revenue without discouraging work. |
| Economic Implication | Policy tool for managing inflation and employment levels. | Guides tax policy decisions to avoid over-taxation and under-collection. |
| Graph Shape | Downward sloping curve. | Inverted U-shaped curve. |
| Key Variables | Inflation rate, Unemployment rate. | Tax rate, Tax revenue. |
| Use in Policy | Adjust inflation or unemployment through monetary or fiscal policy. | Set tax rates to optimize revenue without harming economic incentives. |
Introduction to the Phillips Curve and Laffer Curve
The Phillips Curve illustrates the inverse relationship between unemployment and inflation, suggesting that lower unemployment rates can lead to higher inflation. The Laffer Curve demonstrates the connection between tax rates and tax revenue, indicating that there is an optimal tax rate that maximizes government revenue without discouraging economic activity. Both curves provide critical insights for policymakers balancing inflation control, employment levels, and effective taxation strategies.
Historical Origins of the Phillips Curve
The Phillips curve originated from A.W. Phillips' 1958 study, which demonstrated an inverse relationship between unemployment and wage inflation in the UK from 1861 to 1957. This empirical observation later evolved into a broader macroeconomic concept linking inflation and unemployment rates. Unlike the Laffer curve, which explores tax rates and revenue, the Phillips curve primarily addresses labor market dynamics and inflation trade-offs.
Theoretical Foundations of the Laffer Curve
The Laffer Curve is grounded in the theoretical premise that there exists an optimal tax rate maximizing government revenue without dampening economic incentives. It illustrates the relationship between tax rates and tax revenue, suggesting that beyond a certain tax rate, increases actually reduce overall revenue due to lower work effort and investment. This curve contrasts with the Phillips Curve by emphasizing supply-side responses and the behavioral impact of taxation rather than the trade-off between inflation and unemployment.
Key Differences: Unemployment vs. Taxation
The Phillips curve illustrates the inverse relationship between unemployment and inflation, highlighting how lower unemployment can drive higher wage growth and price increases. The Laffer curve demonstrates the relationship between tax rates and tax revenue, showing that beyond a certain point, higher tax rates can reduce overall revenue by discouraging work and investment. Key differences lie in their focus: the Phillips curve addresses labor market dynamics and inflation trade-offs, while the Laffer curve centers on taxation policy and government revenue optimization.
Policy Implications of the Phillips Curve
The Phillips Curve illustrates the inverse relationship between unemployment and inflation, guiding policymakers to balance these factors when formulating monetary and fiscal strategies. By targeting lower unemployment, governments may accept higher inflation, which can stimulate demand and economic growth but risks overheating the economy. Understanding this trade-off helps in designing policies that aim for optimal employment levels without triggering excessive inflation or wage-price spirals.
Fiscal Policy Insights from the Laffer Curve
The Laffer Curve illustrates the relationship between tax rates and government revenue, suggesting that beyond a certain point, higher tax rates can lead to decreased revenue due to reduced economic activity. Fiscal policy insights derived from the Laffer Curve emphasize the importance of optimizing tax rates to maximize revenue without stifling growth or labor supply. Unlike the Phillips Curve, which focuses on inflation and unemployment trade-offs, the Laffer Curve provides a framework for balancing taxation levels to enhance fiscal sustainability and economic efficiency.
Criticisms and Limitations of Both Curves
The Phillips curve faces criticism for its inability to hold true during stagflation periods, where high inflation and unemployment coexist, challenging the inverse relationship it proposes. The Laffer curve is limited by its theoretical nature and difficulty in pinpointing the exact tax rate that maximizes revenue, as real-world factors like taxpayer behavior and economic conditions vary widely. Both curves oversimplify complex economic dynamics, ignoring structural changes, expectations, and external shocks that critically influence inflation, unemployment, and tax revenues.
Real-World Applications and Case Studies
The Phillips curve illustrates the inverse relationship between unemployment and inflation, demonstrated by the 1960s U.S. economy where low unemployment coincided with rising inflation. The Laffer curve models the relationship between tax rates and tax revenue, with the 1980s U.S. tax cuts serving as a case study where reduced rates aimed to stimulate economic growth without sacrificing revenue. Policymakers use these curves to balance inflation control and incentive structures, tailoring fiscal and monetary interventions based on empirical outcomes.
Relevance in Modern Economic Debates
The Phillips curve, illustrating the inverse relationship between inflation and unemployment, remains crucial in analyzing monetary policy trade-offs during economic fluctuations. The Laffer curve, which highlights the relationship between tax rates and tax revenue, is pivotal in shaping debates on optimal taxation and fiscal stimulus effectiveness. Both models influence modern economic policies by addressing inflation control, employment strategies, and tax incentives to foster sustainable growth.
Conclusion: Comparing Economic Tools for Policymakers
The Phillips curve highlights the trade-off between inflation and unemployment, guiding policymakers on managing short-term economic fluctuations. The Laffer curve emphasizes the relationship between tax rates and government revenue, informing fiscal strategies to optimize tax policy without hindering economic growth. Policymakers must consider both curves to balance inflation control, employment levels, and tax revenues for sustainable economic stability.
Phillips curve vs Laffer curve Infographic