The Gini coefficient quantifies income inequality by measuring the area between the Lorenz curve and the line of perfect equality, with values ranging from 0 (perfect equality) to 1 (maximum inequality). The Lorenz curve visually represents the distribution of income or wealth within a population, plotting the cumulative percentage of total income earned against the cumulative percentage of recipients. Together, these tools provide a comprehensive understanding of economic disparities and facilitate comparisons across different regions or time periods.
Table of Comparison
| Aspect | Gini Coefficient | Lorenz Curve |
|---|---|---|
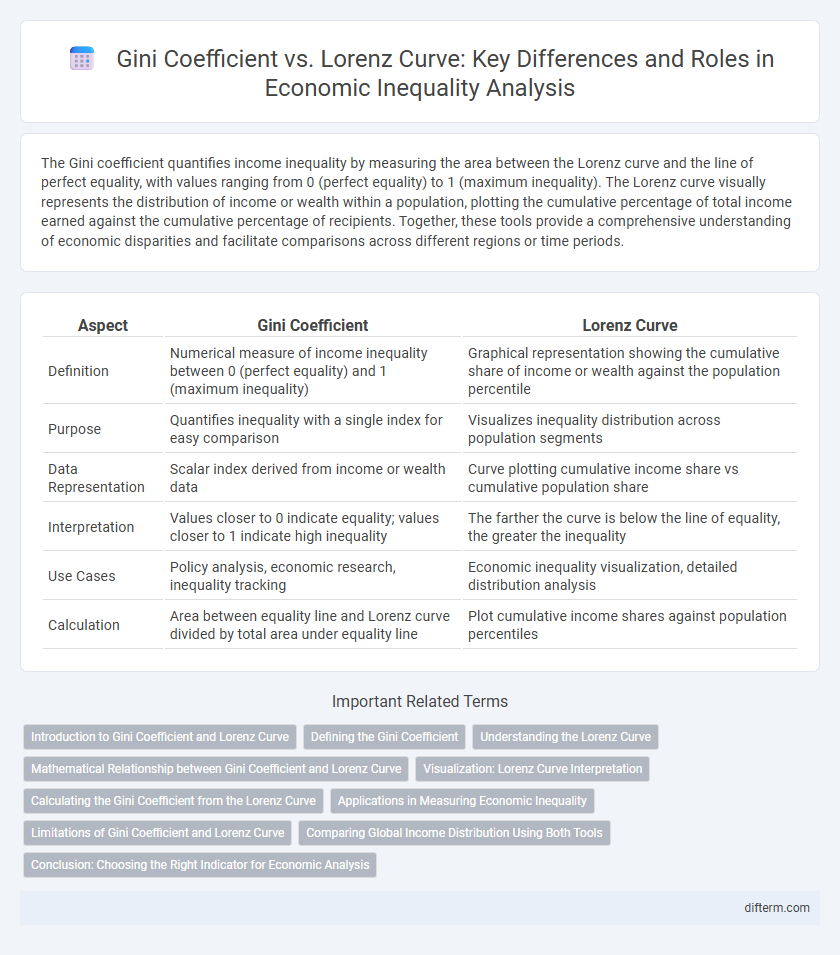
| Definition | Numerical measure of income inequality between 0 (perfect equality) and 1 (maximum inequality) | Graphical representation showing the cumulative share of income or wealth against the population percentile |
| Purpose | Quantifies inequality with a single index for easy comparison | Visualizes inequality distribution across population segments |
| Data Representation | Scalar index derived from income or wealth data | Curve plotting cumulative income share vs cumulative population share |
| Interpretation | Values closer to 0 indicate equality; values closer to 1 indicate high inequality | The farther the curve is below the line of equality, the greater the inequality |
| Use Cases | Policy analysis, economic research, inequality tracking | Economic inequality visualization, detailed distribution analysis |
| Calculation | Area between equality line and Lorenz curve divided by total area under equality line | Plot cumulative income shares against population percentiles |
Introduction to Gini Coefficient and Lorenz Curve
The Gini coefficient quantifies income inequality within a population, ranging from 0 (perfect equality) to 1 (maximum inequality). The Lorenz curve graphically represents income or wealth distribution by plotting the cumulative percentage of total income against the cumulative percentage of recipients. Together, these tools provide critical insights for economists assessing economic disparity and policy impact.
Defining the Gini Coefficient
The Gini coefficient quantifies income inequality by measuring the area between the Lorenz curve and the line of perfect equality, with values ranging from 0 (complete equality) to 1 (complete inequality). This metric provides a single scalar value that summarizes the distribution of income or wealth within a population. By analyzing the deviation of the Lorenz curve from the equality line, economists can assess the degree of economic disparity in a given society.
Understanding the Lorenz Curve
The Lorenz curve visually represents income or wealth distribution within a population by plotting the cumulative percentage of total income earned against the cumulative percentage of recipients. It provides a graphical illustration of economic inequality, showing how far the actual distribution deviates from perfect equality, represented by the 45-degree diagonal line. The Gini coefficient quantifies this inequality by measuring the area between the Lorenz curve and the line of equality, with values ranging from 0 (perfect equality) to 1 (maximum inequality).
Mathematical Relationship between Gini Coefficient and Lorenz Curve
The Gini coefficient quantifies income inequality by measuring the area between the Lorenz curve and the line of perfect equality, normalized by the total area under the equality line. Mathematically, the Gini coefficient \(G\) equals twice the integral of the difference between the line of equality and the Lorenz curve \(L(p)\) over the unit interval, expressed as \(G = 2 \int_0^1 (p - L(p)) \, dp\). This integral-based relationship highlights that the Gini coefficient directly depends on the shape of the Lorenz curve, providing a scalar summary of distributional inequality.
Visualization: Lorenz Curve Interpretation
The Lorenz curve visualizes income distribution by plotting cumulative population percentages against cumulative income shares, highlighting inequality levels within an economy. The more the curve bows away from the 45-degree line of perfect equality, the greater the disparity in wealth or income distribution. Interpreting the curve enables analysts to assess the extent of economic inequality, which complements the Gini coefficient as a numerical summary of the same data.
Calculating the Gini Coefficient from the Lorenz Curve
The Gini coefficient is calculated from the Lorenz curve by measuring the area between the line of perfect equality and the Lorenz curve itself, representing income or wealth distribution. This coefficient is derived as the ratio of the area between the equality line and the Lorenz curve to the total area under the equality line, ranging from 0 (perfect equality) to 1 (maximal inequality). Precise calculation of the Gini coefficient requires integrating the Lorenz curve function or using numerical methods based on discrete data points from income distribution.
Applications in Measuring Economic Inequality
The Gini coefficient quantifies income inequality by summarizing the dispersion shown in the Lorenz curve, which graphically represents the cumulative income distribution among a population. Policymakers and economists rely on the Gini coefficient to compare inequality across different regions and track changes over time, enabling targeted interventions. The Lorenz curve's shape aids in visualizing disparities, while the Gini index provides a precise numeric value essential for statistical analysis and economic modeling.
Limitations of Gini Coefficient and Lorenz Curve
The Gini coefficient, while widely used to measure income inequality, oversimplifies distribution by condensing data into a single value, which can mask variations in different income segments. The Lorenz curve provides a more detailed graphical representation of income distribution but lacks a standardized metric for direct comparison between populations. Both methods struggle to capture multidimensional inequality factors like wealth, social mobility, and access to services, limiting their effectiveness in comprehensive economic analyses.
Comparing Global Income Distribution Using Both Tools
The Gini coefficient quantifies income inequality on a scale from 0 to 1, where 0 represents perfect equality and 1 indicates maximal inequality, providing a single numerical value for comparison across countries. The Lorenz curve graphically represents income distribution by plotting the cumulative percentage of total income received against the cumulative percentage of the population, visually illustrating disparities. Combining both tools enhances the analysis of global income distribution by offering both a clear inequality metric and a detailed visual representation of how income is spread within different economies.
Conclusion: Choosing the Right Indicator for Economic Analysis
The Gini coefficient quantifies income inequality with a single value, making it ideal for straightforward comparisons and trend analysis across regions or time periods. The Lorenz curve offers a detailed graphical representation of income distribution, providing insight into the proportion of total income earned by different population segments. Selecting the right indicator depends on whether the analysis requires a concise inequality measure or a comprehensive visualization of income distribution patterns.
Gini coefficient vs Lorenz curve Infographic