A Cap Table details the ownership stakes, equity dilution, and investor shares within a company, providing a clear overview of financial control. An Org Chart visually represents the company's internal structure, highlighting roles, hierarchy, and reporting lines among employees. Both tools are essential for business strategy but focus on different aspects: financial ownership versus operational management.
Table of Comparison
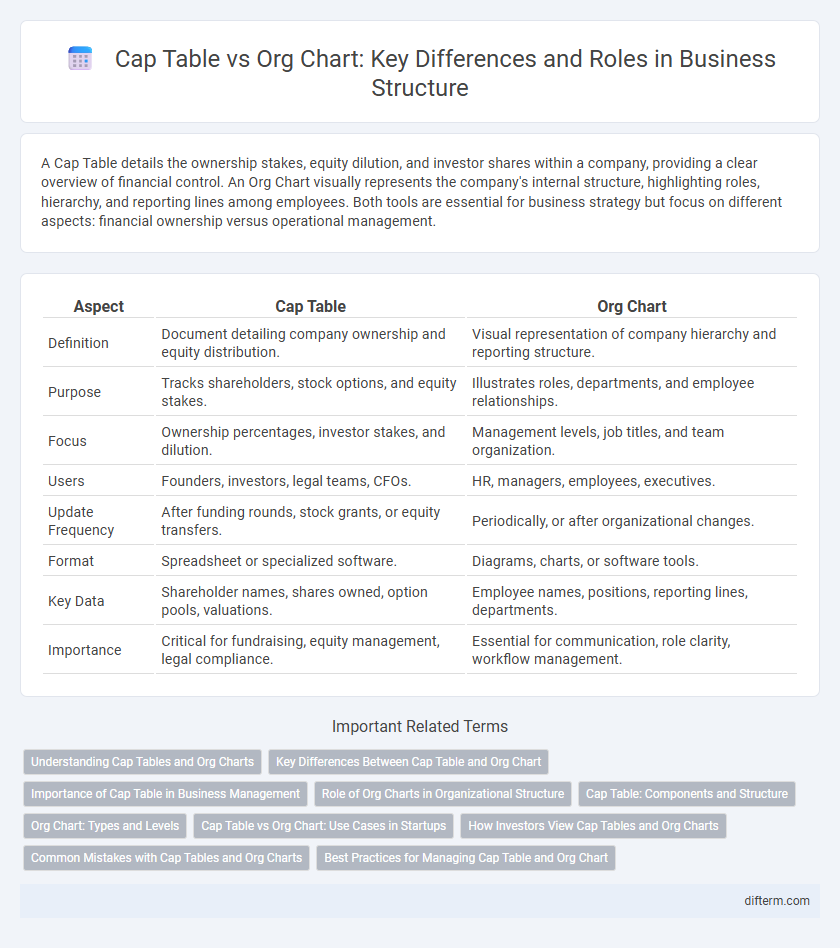
| Aspect | Cap Table | Org Chart |
|---|---|---|
| Definition | Document detailing company ownership and equity distribution. | Visual representation of company hierarchy and reporting structure. |
| Purpose | Tracks shareholders, stock options, and equity stakes. | Illustrates roles, departments, and employee relationships. |
| Focus | Ownership percentages, investor stakes, and dilution. | Management levels, job titles, and team organization. |
| Users | Founders, investors, legal teams, CFOs. | HR, managers, employees, executives. |
| Update Frequency | After funding rounds, stock grants, or equity transfers. | Periodically, or after organizational changes. |
| Format | Spreadsheet or specialized software. | Diagrams, charts, or software tools. |
| Key Data | Shareholder names, shares owned, option pools, valuations. | Employee names, positions, reporting lines, departments. |
| Importance | Critical for fundraising, equity management, legal compliance. | Essential for communication, role clarity, workflow management. |
Understanding Cap Tables and Org Charts
Cap tables provide a detailed breakdown of a company's ownership structure, listing shareholders, equity stakes, and types of securities, essential for tracking dilution and fundraising impact. Org charts visually represent the hierarchical structure, roles, and reporting relationships within the company, clarifying operational and management responsibilities. Understanding both tools allows businesses to manage equity distribution effectively while maintaining clear leadership and organizational transparency.
Key Differences Between Cap Table and Org Chart
A Cap Table details a company's ownership structure, including equity stakes, types of shares, and investor information to track ownership percentages and financial rights. An Org Chart, however, visually represents the company's internal hierarchy, outlining roles, reporting lines, and departmental organization. Whereas a Cap Table is essential for understanding shareholder equity and fundraising implications, an Org Chart is critical for managing team dynamics and operational workflows.
Importance of Cap Table in Business Management
A capitalization table (Cap Table) is crucial for business management as it provides a detailed breakdown of equity ownership, including shareholders, types of shares, and percentage ownership, which directly impacts decision-making and fundraising strategies. Unlike an organizational chart that outlines company hierarchy and roles, a Cap Table offers transparency on financial stakes, enabling accurate valuation and control over dilution during investment rounds. Proper management of the Cap Table ensures alignment among founders, investors, and employees, fostering trust and facilitating strategic growth.
Role of Org Charts in Organizational Structure
Org charts visualize the hierarchical structure, clarifying reporting lines and functional roles within an organization to enhance communication and streamline decision-making. Unlike cap tables, which detail ownership stakes and equity distribution among shareholders, org charts focus on operational roles and departmental relationships. This clarity supports efficient resource allocation and strategic planning by illustrating team dynamics and leadership responsibilities.
Cap Table: Components and Structure
A Cap Table, or capitalization table, details a company's ownership structure, listing equity holders, share classes, and their respective ownership percentages. Key components include common shares, preferred shares, options, warrants, and convertible securities, outlining dilution effects and investor stakes. This structured data is essential for understanding ownership distribution, financing rounds, and potential impacts on control and valuation.
Org Chart: Types and Levels
Org charts visually represent a company's internal structure, illustrating roles, responsibilities, and reporting relationships across various levels such as executive, managerial, and operational tiers. Common types include hierarchical, matrix, and flat org charts, each suited for different organizational models and communication flows. Understanding these types and levels enhances clarity in decision-making, improves workflow, and supports strategic growth within business environments.
Cap Table vs Org Chart: Use Cases in Startups
Cap tables track ownership percentages, equity stakes, and investor details essential for fundraising and equity management in startups, enabling precise control over dilution and investor rights. Org charts visually represent the company's hierarchical structure, clarifying roles, reporting lines, and operational responsibilities to optimize team collaboration and decision-making. Startups rely on cap tables for financial governance and investment negotiations, while org charts are crucial for internal management and aligning team workflows.
How Investors View Cap Tables and Org Charts
Investors analyze cap tables to understand ownership distribution, equity stakes, and potential dilution risks in a startup, providing critical insight into control and financial upside. Org charts reveal the company's hierarchy, key roles, and management structure, helping investors assess operational effectiveness and leadership depth. Together, these tools offer a comprehensive view of both financial ownership and organizational capacity crucial for investment decisions.
Common Mistakes with Cap Tables and Org Charts
Common mistakes with cap tables include failing to update equity changes promptly, inaccurately reflecting ownership percentages, and neglecting to account for stock options or convertible securities. Org charts often suffer from unclear reporting lines, outdated positions, and inconsistent role definitions that undermine organizational clarity. Ensuring accurate, real-time updates in both cap tables and org charts is critical for effective business management and stakeholder communication.
Best Practices for Managing Cap Table and Org Chart
Effective management of a cap table requires regular updates that accurately reflect equity ownership, stock options, and investor stakes to ensure transparency and compliance. Maintaining an org chart with clear hierarchical roles and reporting lines supports operational clarity and enhances communication across all levels of the organization. Integrating cap table data with the org chart facilitates strategic decision-making by aligning ownership structure with organizational responsibilities and growth planning.
Cap Table vs Org Chart Infographic