Retention rate measures the percentage of customers who continue to use a business's products or services over a specific period, indicating customer loyalty and satisfaction. Churn rate represents the proportion of customers who stop doing business with a company within the same timeframe, highlighting potential issues in customer experience or product value. Monitoring both rates provides actionable insights to improve customer engagement and drive business growth.
Table of Comparison
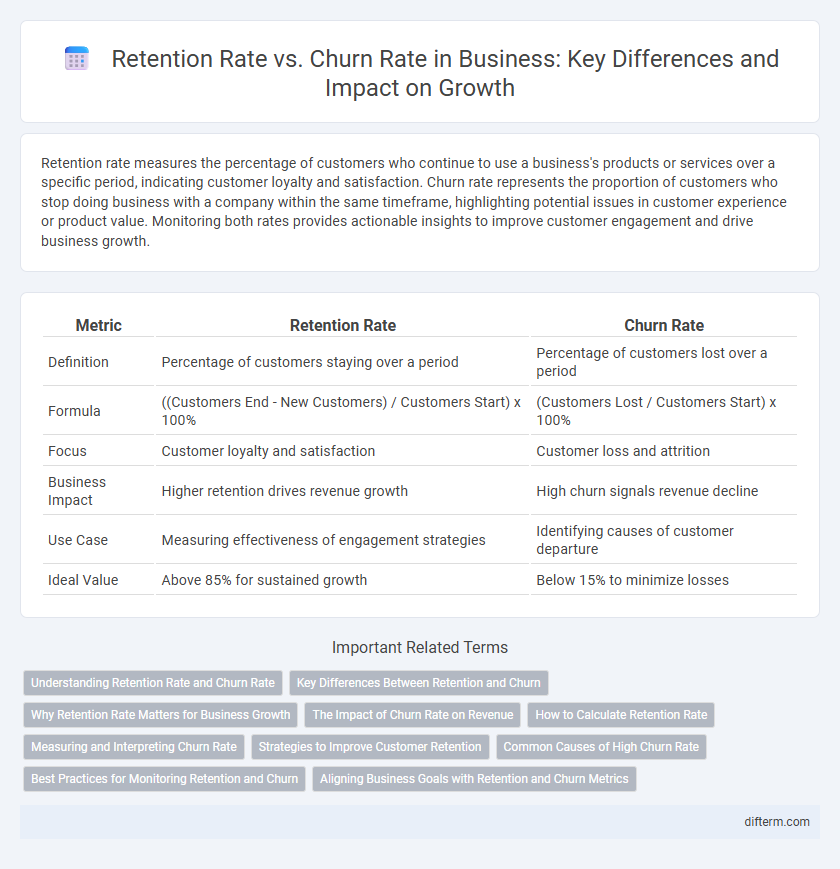
| Metric | Retention Rate | Churn Rate |
|---|---|---|
| Definition | Percentage of customers staying over a period | Percentage of customers lost over a period |
| Formula | ((Customers End - New Customers) / Customers Start) x 100% | (Customers Lost / Customers Start) x 100% |
| Focus | Customer loyalty and satisfaction | Customer loss and attrition |
| Business Impact | Higher retention drives revenue growth | High churn signals revenue decline |
| Use Case | Measuring effectiveness of engagement strategies | Identifying causes of customer departure |
| Ideal Value | Above 85% for sustained growth | Below 15% to minimize losses |
Understanding Retention Rate and Churn Rate
Retention rate measures the percentage of customers who continue using a product or service over a specific period, reflecting customer loyalty and satisfaction. Churn rate quantifies the percentage of customers who stop using a product or service within a given timeframe, indicating potential issues in customer experience or product value. Understanding these metrics helps businesses optimize customer engagement strategies and improve long-term profitability.
Key Differences Between Retention and Churn
Retention rate measures the percentage of customers who continue to engage with a business over a specific period, reflecting customer loyalty and satisfaction. Churn rate quantifies the proportion of customers who discontinue their relationship with the company, indicating potential dissatisfaction or market competition. Understanding these metrics helps businesses identify growth opportunities and areas needing improvement to enhance customer lifetime value.
Why Retention Rate Matters for Business Growth
Retention rate directly impacts revenue stability by maintaining a loyal customer base, which reduces the need for costly acquisition strategies. High retention strengthens brand trust and increases customer lifetime value, fueling sustainable business growth. Businesses with superior retention rates outperform competitors by leveraging repeat purchases and positive referrals.
The Impact of Churn Rate on Revenue
High churn rate directly decreases recurring revenue by increasing customer loss, forcing businesses to invest more in acquiring new clients to maintain income levels. Poor retention leads to greater customer acquisition costs, which diminish profit margins and slow growth trajectories. Monitoring churn rate alongside retention rate enables businesses to identify weaknesses in customer satisfaction and implement targeted strategies to stabilize revenue streams.
How to Calculate Retention Rate
Retention rate is calculated by dividing the number of customers who continue using a product or service during a specific period by the total number of customers at the start of that period, then multiplying by 100 to express it as a percentage. For example, if a company starts with 1,000 customers and retains 850 by the end of the month, the retention rate is (850/1000) * 100 = 85%. This metric is crucial for understanding customer loyalty and the effectiveness of retention strategies compared to churn rate, which measures customer loss.
Measuring and Interpreting Churn Rate
Churn rate measures the percentage of customers who stop using a product or service within a given period, providing critical insights into customer attrition. Accurate calculation involves tracking the number of lost customers divided by the total customers at the start of the period, enabling businesses to identify weaknesses in customer satisfaction or product value. Interpreting churn rate alongside retention metrics helps companies develop targeted strategies to enhance customer loyalty and drive sustainable growth.
Strategies to Improve Customer Retention
Improving customer retention requires targeted strategies such as personalized communication, loyalty programs, and proactive customer support to reduce churn rate effectively. Leveraging data analytics enables businesses to identify at-risk customers and tailor retention efforts for maximum impact. Enhancing product value and customer experience consistently strengthens loyalty and drives higher retention rates over time.
Common Causes of High Churn Rate
High churn rate often results from poor customer service, inadequate product quality, and misaligned customer expectations. Ineffective onboarding processes and lack of continuous engagement also contribute significantly to customer attrition. Addressing these issues enhances retention rate by fostering customer loyalty and satisfaction.
Best Practices for Monitoring Retention and Churn
Effective monitoring of retention and churn rates involves leveraging advanced analytics tools to track customer behavior and engagement patterns in real time. Implementing customer feedback loops and satisfaction surveys provides actionable insights that help identify at-risk customers and improve service quality. Benchmarking against industry standards and setting clear, measurable KPIs ensures alignment with business objectives and drives continuous improvement in customer retention strategies.
Aligning Business Goals with Retention and Churn Metrics
Retention rate and churn rate are critical metrics that directly impact business growth and profitability by measuring customer loyalty and attrition. Aligning business goals with these metrics ensures targeted strategies that enhance customer satisfaction, increase lifetime value, and reduce revenue loss. Businesses that consistently monitor and optimize retention rate while minimizing churn rate achieve sustainable competitive advantage and improved financial performance.
Retention Rate vs Churn Rate Infographic