Heat mapping provides detailed insights into customer behavior by visually representing high-traffic areas and dwell times within a retail pet store, enabling tailored product placement and store layout optimizations. Traffic counting offers quantitative data on the number of visitors, helping to measure store performance and peak hours accurately. Combining both technologies enhances decision-making by correlating overall foot traffic with specific customer interactions and movement patterns.
Table of Comparison
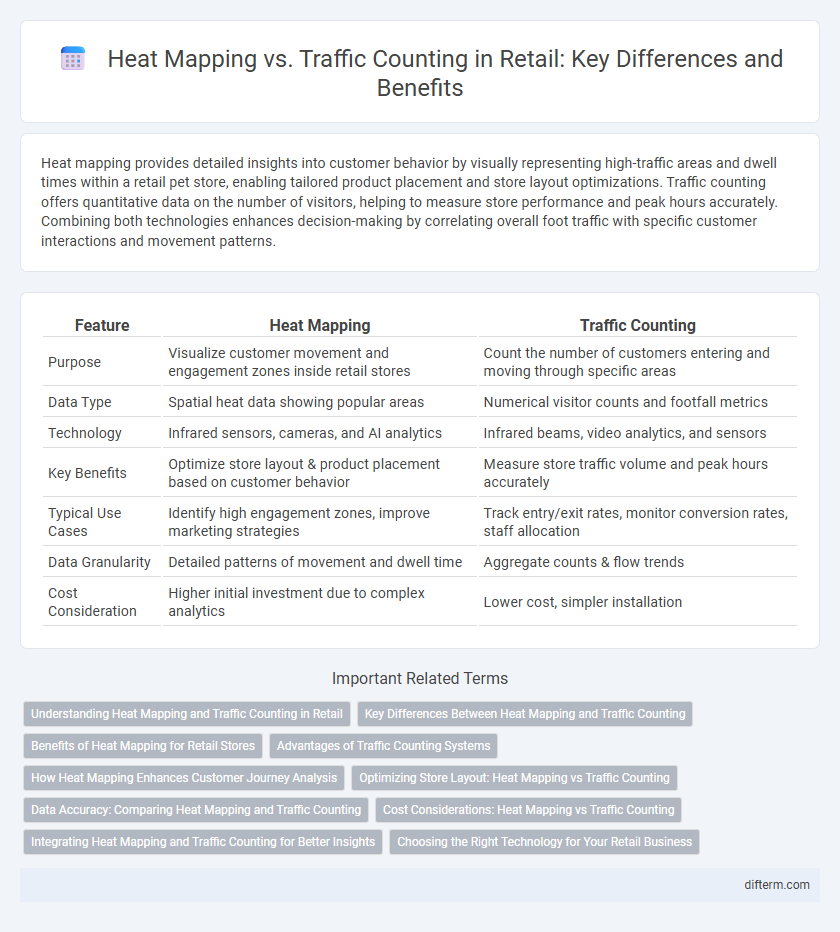
| Feature | Heat Mapping | Traffic Counting |
|---|---|---|
| Purpose | Visualize customer movement and engagement zones inside retail stores | Count the number of customers entering and moving through specific areas |
| Data Type | Spatial heat data showing popular areas | Numerical visitor counts and footfall metrics |
| Technology | Infrared sensors, cameras, and AI analytics | Infrared beams, video analytics, and sensors |
| Key Benefits | Optimize store layout & product placement based on customer behavior | Measure store traffic volume and peak hours accurately |
| Typical Use Cases | Identify high engagement zones, improve marketing strategies | Track entry/exit rates, monitor conversion rates, staff allocation |
| Data Granularity | Detailed patterns of movement and dwell time | Aggregate counts & flow trends |
| Cost Consideration | Higher initial investment due to complex analytics | Lower cost, simpler installation |
Understanding Heat Mapping and Traffic Counting in Retail
Heat mapping in retail analyzes customer interactions and movement patterns within a store, revealing high-engagement zones and product interest areas through visual data overlays. Traffic counting measures the number of visitors entering or passing specific locations, providing quantitative insights into store footfall and peak shopping times. Combining heat mapping with traffic counting enables retailers to optimize store layouts, improve product placement, and enhance overall customer experience by aligning spatial analytics with visitor volume trends.
Key Differences Between Heat Mapping and Traffic Counting
Heat mapping in retail visually represents customer movement patterns and dwell times by tracking specific areas where shoppers engage most within a store, while traffic counting quantifies the total number of visitors entering or passing through particular zones. Heat maps provide granular insights into shopper behavior and product interaction, aiding in optimizing store layouts and merchandising strategies, whereas traffic counting offers essential data on store footfall and peak shopping periods. Both tools serve complementary roles: heat mapping enhances behavioral analysis, and traffic counting supports overall customer flow and operational planning.
Benefits of Heat Mapping for Retail Stores
Heat mapping in retail stores provides precise visual data on customer movement patterns, enabling targeted product placement and enhanced store layout optimization to boost sales. Unlike traffic counting, which only measures the number of visitors, heat maps reveal dwell times and interaction zones, helping retailers identify high-engagement areas and optimize merchandising strategies. By leveraging heat mapping analytics, retailers can improve customer experience, increase conversion rates, and strategically allocate in-store resources for maximum profitability.
Advantages of Traffic Counting Systems
Traffic counting systems provide precise data on customer flow and peak times, enabling retailers to optimize staffing and store layout efficiently. These systems offer real-time analytics, allowing for quick adjustments to marketing strategies and inventory management based on actual foot traffic patterns. Unlike heat mapping, traffic counting delivers quantifiable metrics critical for improving operational decisions and enhancing overall store performance.
How Heat Mapping Enhances Customer Journey Analysis
Heat mapping provides detailed visual insights into customer behavior by tracking precise movements and interactions within retail spaces, highlighting hotspots and areas of interest that traffic counting alone cannot reveal. By analyzing heat maps, retailers can optimize store layouts, product placements, and marketing strategies to improve customer engagement and sales conversion rates. Integrating heat mapping data with traffic counting enhances the depth and accuracy of customer journey analysis, driving more informed business decisions.
Optimizing Store Layout: Heat Mapping vs Traffic Counting
Heat mapping provides detailed insights into customer movement patterns by visually representing high-traffic zones and dwell times using color-coded data, enabling retailers to strategically place products and promotional displays for maximum engagement. Traffic counting quantifies the number of visitors entering and moving through specific store areas, offering essential metrics on footfall trends and peak hours that aid in staff allocation and operational efficiency. Combining heat mapping with traffic counting allows retailers to optimize store layout comprehensively, improving customer experience and driving sales through data-driven spatial organization.
Data Accuracy: Comparing Heat Mapping and Traffic Counting
Heat mapping provides detailed visualization of customer movement patterns within retail spaces, enabling precise identification of high-engagement zones. Traffic counting delivers quantitative data on the number of visitors entering and moving through specific areas, offering straightforward metrics for store performance analysis. Combining both methods enhances data accuracy by correlating visitor volume with behavioral insights, leading to better-informed retail strategies.
Cost Considerations: Heat Mapping vs Traffic Counting
Heat mapping systems typically require higher initial investments due to advanced sensor technologies and data analytics software, whereas traffic counting solutions often involve more affordable, simpler hardware like infrared or video counters. Operational costs for heat mapping also include ongoing data processing and detailed visualization services, while traffic counting usually demands less maintenance and lower data storage expenses. Retailers must weigh these cost factors against their need for granular customer behavior insights versus basic foot traffic metrics.
Integrating Heat Mapping and Traffic Counting for Better Insights
Integrating heat mapping with traffic counting provides retailers a comprehensive understanding of customer behavior and store performance by combining spatial movement patterns with quantitative foot traffic data. Heat mapping visualizes high-engagement zones while traffic counting offers accurate visitor numbers, enabling precise optimization of store layout and product placement. Leveraging both technologies enhances decision-making for targeted marketing strategies and improved customer experience in retail environments.
Choosing the Right Technology for Your Retail Business
Heat mapping technology provides detailed insights into customer behavior by visually representing high-traffic zones and engagement areas within the store, enabling retailers to optimize product placement and store layout effectively. Traffic counting systems quantify the number of visitors, offering accurate data on footfall trends and peak shopping times essential for staffing and inventory management. Selecting the right technology depends on specific business goals, balancing the need for behavioral analytics from heat maps with the straightforward visitor metrics from traffic counters to drive informed retail decisions.
heat mapping vs traffic counting Infographic