Comp store sales in retail pet stores reflect the performance of established locations by comparing current sales with the same period last year, providing a clear measure of business growth without the influence of new store openings. Total store sales include both comp store sales and revenue from new stores, offering a comprehensive view of overall company performance. Analyzing comp store sales separately helps identify organic growth trends and customer loyalty, while total store sales highlight the impact of expansion strategies.
Table of Comparison
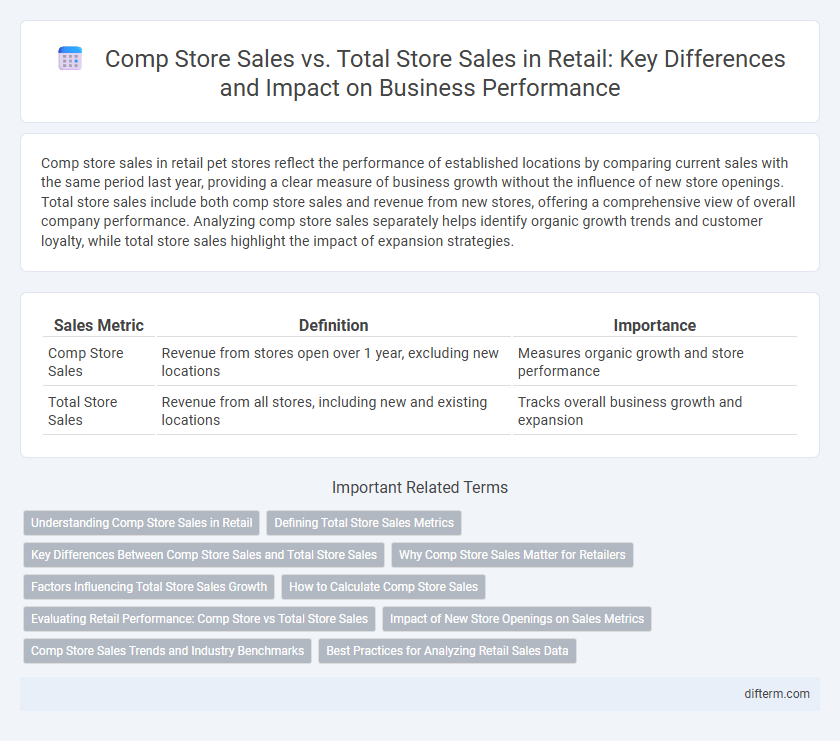
| Sales Metric | Definition | Importance |
|---|---|---|
| Comp Store Sales | Revenue from stores open over 1 year, excluding new locations | Measures organic growth and store performance |
| Total Store Sales | Revenue from all stores, including new and existing locations | Tracks overall business growth and expansion |
Understanding Comp Store Sales in Retail
Comp store sales, or comparable store sales, measure revenue performance of retail locations open for a year or more, excluding new or closed stores, providing a clear view of organic growth. Total store sales reflect overall revenue, combining comp store sales with contributions from newly opened or closed locations. Analyzing comp store sales helps retailers evaluate same-store sales trends, customer loyalty, and operational effectiveness without distortion from store count changes.
Defining Total Store Sales Metrics
Total store sales metrics encompass the overall revenue generated by all store locations within a specific period, including both newly opened and existing outlets. Comp store sales specifically measure sales performance of stores open for at least one year, providing critical insight into organic growth by excluding revenue from newer stores. Analyzing both metrics allows retailers to distinguish between growth driven by store expansion and underlying changes in established store productivity.
Key Differences Between Comp Store Sales and Total Store Sales
Comp store sales measure revenue generated by stores open for at least one year, providing a clear indicator of organic growth and performance stability. Total store sales include all outlets, encompassing new openings and closures, which can skew growth analysis due to expansion activities. Understanding these differences is critical for accurately assessing operational efficiency and the sustainability of sales trends in retail.
Why Comp Store Sales Matter for Retailers
Comp store sales, which track revenue changes in stores open at least one year, provide retailers with crucial insights into true business growth excluding new store impact. These sales highlight customer retention, operational efficiency, and marketing effectiveness within established locations, guiding strategic decisions for inventory and staffing. Monitoring comp store sales enables retailers to identify performance trends, enhance profitability, and optimize store portfolio management against total store sales growth.
Factors Influencing Total Store Sales Growth
Total store sales growth is primarily driven by comp store sales performance, which reflects revenue changes in existing locations excluding new outlets. Factors influencing total store sales include store expansion strategies, market penetration, consumer demand shifts, and promotional effectiveness. Enhancing product assortments and optimizing store layouts further amplify comp store sales, collectively boosting overall retail growth.
How to Calculate Comp Store Sales
To calculate comp store sales, compare the current period's revenue from stores open at least one year to the same period in the previous year, excluding new or closed locations to ensure consistent data. Divide the difference in sales by the previous year's sales and multiply by 100 to express the growth percentage. This metric isolates performance of established stores, providing valuable insight into organic business growth in the retail industry.
Evaluating Retail Performance: Comp Store vs Total Store Sales
Evaluating retail performance hinges on understanding comp store sales, which measure revenue from stores open at least one year, providing a clear indicator of organic growth by isolating existing locations from new openings. Total store sales combine comp store sales with revenue from newly opened stores, reflecting overall company growth but potentially masking operational efficiency. Analyzing the gap between comp store sales and total store sales enables retailers to assess both the health of established stores and the impact of expansion strategies on overall revenue.
Impact of New Store Openings on Sales Metrics
Comparable store sales provide a clearer measure of organic growth by excluding revenue from newly opened stores, which can temporarily boost total store sales figures. New store openings often drive initial sales surges but can mask underlying performance trends if analyzed solely through total store sales. Evaluating both metrics allows retailers to distinguish sustainable growth from expansion-driven increases, aiding strategic decision-making and performance assessment.
Comp Store Sales Trends and Industry Benchmarks
Comp store sales growth is a critical indicator of retail performance, often signaling active customer engagement and effective marketing strategies. Industry benchmarks reveal that a consistent positive trend in comp store sales, averaging between 2% to 5% annually, reflects healthy store-level momentum compared to total store sales, which also factor in new store openings and closures. Retailers outperforming these benchmarks typically leverage data analytics and localized merchandising to sustain comp store sales growth and enhance overall profitability.
Best Practices for Analyzing Retail Sales Data
Analyzing retail sales data requires distinguishing between comp store sales, which measure revenue changes in stores open at least one year, and total store sales that include new locations. Best practices involve isolating comp sales to assess true organic growth, using consistent reporting periods, and adjusting for external factors such as promotions and seasonality. Leveraging advanced analytics tools can enhance accuracy by identifying trends and anomalies in both comp and total sales datasets.
comp store sales vs total store sales Infographic