The P/E ratio measures a company's stock price relative to its earnings per share, providing insight into market expectations and valuation based on net profits. EBITDA focuses on a company's operating performance by excluding non-operating expenses like interest, taxes, depreciation, and amortization, making it useful for comparing profitability across firms and industries. Investors often analyze both metrics together to assess a company's financial health, distinguishing operational efficiency from overall earnings impact.
Table of Comparison
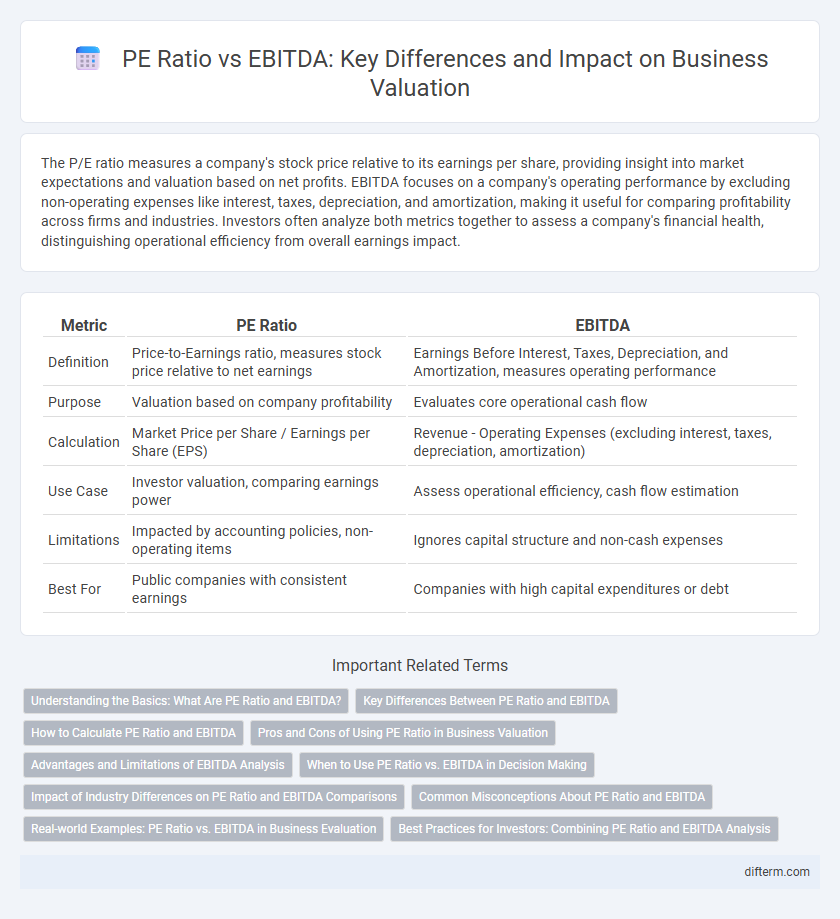
| Metric | PE Ratio | EBITDA |
|---|---|---|
| Definition | Price-to-Earnings ratio, measures stock price relative to net earnings | Earnings Before Interest, Taxes, Depreciation, and Amortization, measures operating performance |
| Purpose | Valuation based on company profitability | Evaluates core operational cash flow |
| Calculation | Market Price per Share / Earnings per Share (EPS) | Revenue - Operating Expenses (excluding interest, taxes, depreciation, amortization) |
| Use Case | Investor valuation, comparing earnings power | Assess operational efficiency, cash flow estimation |
| Limitations | Impacted by accounting policies, non-operating items | Ignores capital structure and non-cash expenses |
| Best For | Public companies with consistent earnings | Companies with high capital expenditures or debt |
Understanding the Basics: What Are PE Ratio and EBITDA?
The Price-to-Earnings (PE) ratio measures a company's current share price relative to its per-share earnings, indicating market expectations of growth and profitability. EBITDA--Earnings Before Interest, Taxes, Depreciation, and Amortization--provides insight into a company's operating performance by isolating earnings from non-operational expenses. Together, these metrics help investors evaluate valuation and operational efficiency, with PE ratio reflecting market sentiment and EBITDA emphasizing cash flow generation.
Key Differences Between PE Ratio and EBITDA
PE ratio measures a company's market value relative to its earnings per share, indicating how much investors are willing to pay for each dollar of profit. EBITDA represents a firm's operational profitability by calculating earnings before interest, taxes, depreciation, and amortization, focusing on cash flow generation. The key difference lies in PE ratio's market valuation aspect versus EBITDA's emphasis on operational performance and cash generation capacity.
How to Calculate PE Ratio and EBITDA
The PE ratio is calculated by dividing the current market price per share by earnings per share (EPS), reflecting investor expectations of a company's profitability. EBITDA, or Earnings Before Interest, Taxes, Depreciation, and Amortization, is derived by adding back these expenses to net profit, providing a clear view of operating performance. Understanding how to calculate both PE ratio and EBITDA allows investors to evaluate valuation and operational efficiency effectively.
Pros and Cons of Using PE Ratio in Business Valuation
The PE ratio offers a straightforward measure of a company's market value relative to its earnings, making it accessible for investors comparing profitability across firms. It can be misleading for businesses with volatile earnings or significant non-operating income since it doesn't account for cash flow, debt, or capital expenditures, unlike EBITDA. Relying solely on PE ratio risks undervaluing or overvaluing firms in capital-intensive industries or those with high depreciation expenses.
Advantages and Limitations of EBITDA Analysis
EBITDA analysis offers advantages by providing a clear measure of operational profitability, excluding non-cash expenses like depreciation and amortization, which allows for better comparison across companies and industries. However, EBITDA limitations include ignoring capital expenditures, changes in working capital, and debt costs, which can mask true financial health or cash flow issues. Unlike the PE ratio, which reflects market valuation relative to earnings, EBITDA focuses strictly on operational efficiency, making it essential to consider both metrics for comprehensive financial analysis.
When to Use PE Ratio vs. EBITDA in Decision Making
The P/E ratio is most effective for evaluating companies with stable earnings and profit margins, particularly in mature industries where net income reflects consistent performance. EBITDA is preferred when comparing companies with varying capital structures, tax rates, or depreciation policies, as it provides a clearer view of operational efficiency and cash flow generation. Decision-makers should use the P/E ratio to assess market valuation relative to earnings, while EBITDA offers insight into operational profitability, especially for capital-intensive businesses or those undergoing restructuring.
Impact of Industry Differences on PE Ratio and EBITDA Comparisons
Industry differences significantly impact PE ratio and EBITDA comparisons, as capital intensity and growth prospects vary widely across sectors. High-growth industries like technology typically exhibit elevated PE ratios despite lower EBITDA margins, while asset-heavy sectors such as manufacturing show lower PE ratios with higher EBITDA multiples due to substantial depreciation expenses. Understanding these industry-specific financial dynamics is crucial for accurate valuation and cross-sector investment analysis.
Common Misconceptions About PE Ratio and EBITDA
Many investors mistakenly believe that the Price-to-Earnings (PE) ratio and EBITDA are interchangeable metrics for evaluating company value, but they measure fundamentally different aspects; PE ratio reflects net income relative to stock price, incorporating depreciation, interest, and taxes, while EBITDA assesses operational profitability before those expenses. Misinterpreting the PE ratio as a direct indicator of cash flow can lead to inaccurate valuations, especially for companies with significant debt or non-cash expenses. Understanding the distinct roles and limitations of both metrics is crucial for accurate financial analysis and investment decision-making.
Real-world Examples: PE Ratio vs. EBITDA in Business Evaluation
The PE ratio, reflecting market valuation relative to earnings, is widely used in industries with stable profitability, such as utilities and consumer goods, highlighting companies like Procter & Gamble with a PE ratio around 25. EBITDA, emphasizing operational cash flow by excluding non-cash expenses, is favored in capital-intensive sectors like telecommunications and manufacturing, demonstrated by AT&T's EBITDA margin of approximately 30%. Real-world business evaluations often combine both metrics to balance market perception with operational performance, providing a comprehensive view for investors and analysts.
Best Practices for Investors: Combining PE Ratio and EBITDA Analysis
Investors optimize valuation accuracy by combining the PE ratio and EBITDA analysis to capture both earnings quality and operational performance. The PE ratio highlights market expectations based on net income relative to share price, while EBITDA offers insight into cash flow and core profitability by excluding non-operating expenses. Best practices involve using PE for growth potential assessment and EBITDA for comparing companies across industries with varying capital structures.
PE ratio vs EBITDA Infographic