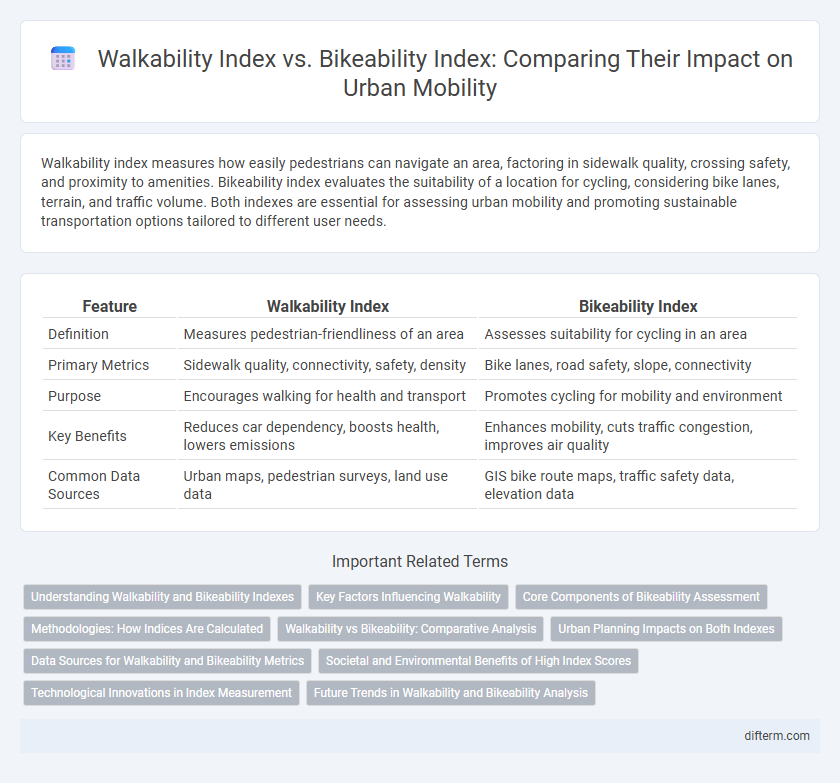
Walkability index measures how easily pedestrians can navigate an area, factoring in sidewalk quality, crossing safety, and proximity to amenities. Bikeability index evaluates the suitability of a location for cycling, considering bike lanes, terrain, and traffic volume. Both indexes are essential for assessing urban mobility and promoting sustainable transportation options tailored to different user needs.
Table of Comparison
| Feature | Walkability Index | Bikeability Index |
|---|---|---|
| Definition | Measures pedestrian-friendliness of an area | Assesses suitability for cycling in an area |
| Primary Metrics | Sidewalk quality, connectivity, safety, density | Bike lanes, road safety, slope, connectivity |
| Purpose | Encourages walking for health and transport | Promotes cycling for mobility and environment |
| Key Benefits | Reduces car dependency, boosts health, lowers emissions | Enhances mobility, cuts traffic congestion, improves air quality |
| Common Data Sources | Urban maps, pedestrian surveys, land use data | GIS bike route maps, traffic safety data, elevation data |
Understanding Walkability and Bikeability Indexes
Walkability index measures how friendly an area is for walking by evaluating factors such as sidewalk quality, pedestrian crossings, and proximity to amenities, while Bikeability index assesses the ease and safety of cycling through metrics like bike lane availability, traffic density, and bike parking options. Both indexes utilize geographic information systems (GIS) and community infrastructure data to provide insights into urban mobility and promote active transportation. Understanding these indexes helps urban planners design cities that improve health outcomes, reduce traffic congestion, and lower environmental impact.
Key Factors Influencing Walkability
Key factors influencing walkability include pedestrian infrastructure quality, connectivity of pathways, and safety measures such as lighting and crosswalks. Walkability indexes prioritize access to amenities within walking distance, sidewalk continuity, and traffic calming features that enhance pedestrian comfort. These elements significantly differ from bikeability indexes, which focus more on dedicated bike lanes, terrain, and secure bike parking.
Core Components of Bikeability Assessment
Bikeability assessment core components emphasize infrastructure quality, connectivity, and safety, including dedicated bike lanes, traffic calming measures, and intersection design to enhance cyclist experience. The walkability index focuses more on pedestrian density, sidewalk availability, and proximity to amenities, whereas bikeability metrics prioritize network completeness and surface conditions. Effective urban mobility planning integrates both indices but tailors interventions to address specific barriers impacting cyclists' accessibility and comfort.
Methodologies: How Indices Are Calculated
Walkability index calculations primarily analyze pedestrian-friendly features such as sidewalk availability, block length, land use diversity, and proximity to amenities using spatial data and GIS tools. Bikeability index methodologies often incorporate factors like bike lane density, traffic safety, elevation changes, and connectivity of cycling networks, quantified through GPS data and infrastructure assessments. Both indices integrate environmental and safety metrics but differ in their emphasis on pedestrian infrastructure for walkability versus cycling-specific infrastructure and terrain for bikeability.
Walkability vs Bikeability: Comparative Analysis
Walkability index assesses the pedestrian-friendliness of an area by measuring factors such as sidewalk quality, street connectivity, and proximity to amenities, which directly influence foot traffic and public health. Bikeability index evaluates cycling infrastructure, including bike lanes, safety features, and terrain, determining the ease and safety of biking as a mode of transport. Comparing walkability and bikeability indexes reveals distinct urban mobility priorities, with walkability emphasizing accessibility and social interaction, while bikeability promotes speed and environmental sustainability.
Urban Planning Impacts on Both Indexes
Urban planning significantly influences both the Walkability Index and the Bikeability Index by shaping street connectivity, safety measures, and accessibility to amenities. Higher walkability correlates with mixed land use, pedestrian infrastructure, and reduced vehicle traffic, while enhanced bikeability depends on dedicated bike lanes, secure parking, and traffic calming designs. Integrated urban designs that prioritize non-motorized transport foster improved physical activity, reduce emissions, and contribute to sustainable city environments.
Data Sources for Walkability and Bikeability Metrics
Walkability and bikeability indexes rely on diverse data sources such as geographic information system (GIS) data, land use patterns, street connectivity, and infrastructure quality to measure urban mobility. Walkability metrics often incorporate pedestrian pathways, sidewalk conditions, safety features, and proximity to amenities, while bikeability data emphasize bike lane availability, traffic density, elevation changes, and bike-sharing stations. Integrating crowd-sourced data, sensor networks, and satellite imagery enhances the accuracy of these indexes for urban planners aiming to improve sustainable transportation options.
Societal and Environmental Benefits of High Index Scores
High walkability and bikeability index scores directly correlate with increased physical activity, reduced greenhouse gas emissions, and improved air quality, leading to healthier urban populations and lower healthcare costs. Neighborhoods designed to score highly on these indices promote social interaction and equitable access to amenities, fostering stronger community cohesion and reducing social isolation. Elevated scores also support sustainable urban development by decreasing reliance on motor vehicles, mitigating traffic congestion, and preserving green spaces.
Technological Innovations in Index Measurement
Technological innovations in measuring walkability and bikeability indexes leverage advanced GIS mapping, real-time data from IoT sensors, and AI-powered analytics to enhance accuracy and usability. High-resolution spatial analysis captures pedestrian and cyclist infrastructure quality, traffic patterns, and safety metrics, enabling dynamic updates to indexes based on current urban conditions. Integration of mobile app data and environmental sensors further refines index precision, supporting smarter urban planning and mobility improvements.
Future Trends in Walkability and Bikeability Analysis
Emerging technologies such as AI-driven urban analytics and real-time sensor data are enhancing the precision of Walkability and Bikeability index measurements, enabling cities to create more responsive mobility solutions. Future trends indicate a convergence of these indices through integrated multimodal transport models that prioritize pedestrian and cyclist safety, accessibility, and convenience. Advanced spatial mapping and predictive algorithms are expected to drive urban planning decisions, fostering environments that support active transportation and reduce reliance on automobiles.
Walkability index vs Bikeability index Infographic