Break-even analysis identifies the sales volume at which total revenue equals total costs, pinpointing the minimum performance required to avoid losses. Sensitivity analysis examines how changes in key variables, such as price or cost, impact profitability and overall business outcomes. Together, these tools help businesses evaluate risk and make informed financial decisions under varying market conditions.
Table of Comparison
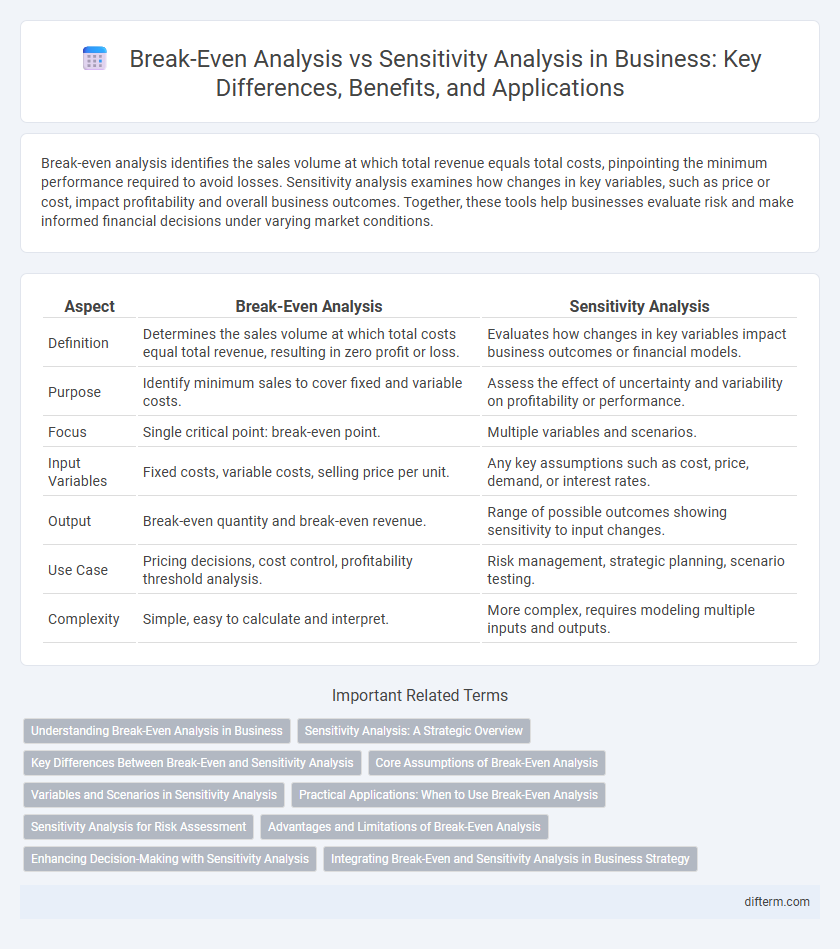
| Aspect | Break-Even Analysis | Sensitivity Analysis |
|---|---|---|
| Definition | Determines the sales volume at which total costs equal total revenue, resulting in zero profit or loss. | Evaluates how changes in key variables impact business outcomes or financial models. |
| Purpose | Identify minimum sales to cover fixed and variable costs. | Assess the effect of uncertainty and variability on profitability or performance. |
| Focus | Single critical point: break-even point. | Multiple variables and scenarios. |
| Input Variables | Fixed costs, variable costs, selling price per unit. | Any key assumptions such as cost, price, demand, or interest rates. |
| Output | Break-even quantity and break-even revenue. | Range of possible outcomes showing sensitivity to input changes. |
| Use Case | Pricing decisions, cost control, profitability threshold analysis. | Risk management, strategic planning, scenario testing. |
| Complexity | Simple, easy to calculate and interpret. | More complex, requires modeling multiple inputs and outputs. |
Understanding Break-Even Analysis in Business
Break-even analysis calculates the sales volume at which total revenues equal total costs, allowing businesses to determine the minimum performance required to avoid losses. This method identifies fixed costs, variable costs per unit, and the break-even point in units or sales dollars, providing critical insights for pricing and budgeting decisions. Break-even analysis serves as a foundational tool in financial planning, helping businesses assess risk and set realistic revenue targets.
Sensitivity Analysis: A Strategic Overview
Sensitivity analysis evaluates how changes in key business variables impact financial outcomes, enabling managers to identify critical factors affecting profitability. By simulating different scenarios, it helps in assessing risks and making informed decisions under uncertainty. This strategic tool complements break-even analysis by providing a broader understanding of potential business performance fluctuations beyond the break-even point.
Key Differences Between Break-Even and Sensitivity Analysis
Break-even analysis determines the sales volume at which total revenues equal total costs, identifying the minimum performance needed to avoid losses. Sensitivity analysis evaluates how variations in key input variables, such as costs, prices, or sales volume, impact financial outcomes or profitability. The key difference lies in break-even analysis focusing on a specific threshold, while sensitivity analysis explores a range of scenarios to assess potential risks and uncertainties.
Core Assumptions of Break-Even Analysis
Break-even analysis primarily relies on fixed costs, variable costs per unit, and sales price per unit as core assumptions to determine the sales volume at which total revenue equals total costs. These assumptions assume constant prices and costs, ignoring potential variations that sensitivity analysis captures by testing how changes in these variables impact profitability. Understanding the rigidity of break-even assumptions highlights the necessity of sensitivity analysis to evaluate risk and uncertainty in business decision-making.
Variables and Scenarios in Sensitivity Analysis
Sensitivity analysis explores how varying key variables such as sales volume, price, and costs impact business outcomes, allowing decision-makers to test multiple scenarios and understand potential risks. In contrast to break-even analysis, which focuses on the specific point where total revenues equal total costs, sensitivity analysis provides a broader evaluation of uncertainties by adjusting assumptions across a range of values. This approach helps businesses anticipate changes in market conditions and prepare strategic responses by evaluating different scenarios' effects on profitability and financial stability.
Practical Applications: When to Use Break-Even Analysis
Break-even analysis is essential for determining the minimum sales volume required to cover costs, making it invaluable during startup planning and pricing strategy decisions. It helps businesses identify the point where revenue equals total costs, enabling clear assessment of profitability thresholds before scaling operations. Break-even analysis is most practical when evaluating fixed and variable cost structures to set realistic sales targets and manage financial risks effectively.
Sensitivity Analysis for Risk Assessment
Sensitivity analysis in business risk assessment evaluates how changes in key variables impact financial outcomes, enabling companies to identify critical factors that influence profitability and cash flow. Unlike break-even analysis, which determines the minimum sales needed to cover costs, sensitivity analysis quantifies the effect of varying inputs such as price, cost, and demand on net income and project viability. This approach enhances decision-making by uncovering potential risks and helping businesses develop strategies to mitigate financial uncertainties.
Advantages and Limitations of Break-Even Analysis
Break-even analysis offers clarity in identifying the sales volume needed to cover fixed and variable costs, providing a straightforward metric for profitability assessment. Its primary limitation lies in the assumption of constant costs and prices, which often does not reflect real-world business dynamics. This method lacks flexibility to accommodate varying market conditions, making it less effective for strategic decisions under uncertainty.
Enhancing Decision-Making with Sensitivity Analysis
Sensitivity analysis enhances decision-making by evaluating how changes in key assumptions impact business outcomes, offering a dynamic perspective that break-even analysis lacks. Unlike break-even analysis, which identifies the fixed point of profitability, sensitivity analysis explores multiple variables' effects on financial performance, enabling more robust risk assessment. This approach empowers managers to anticipate potential challenges and optimize strategies under varying market conditions.
Integrating Break-Even and Sensitivity Analysis in Business Strategy
Integrating break-even and sensitivity analysis in business strategy enhances decision-making by identifying the minimum sales volume required to avoid losses while evaluating how changes in key variables impact profitability. Break-even analysis provides a clear financial threshold, whereas sensitivity analysis quantifies the risk associated with variable fluctuations such as costs, prices, and sales volume. Combining these tools enables businesses to develop robust strategies, optimize resource allocation, and prepare for market uncertainties effectively.
break-even analysis vs sensitivity analysis Infographic