Slugging percentage measures a player's power-hitting ability by calculating total bases per at-bat, while on-base percentage evaluates how frequently a player reaches base through hits, walks, or hit-by-pitches. Both metrics are crucial in assessing offensive performance but highlight different strengths: slugging percentage emphasizes slugging hits, and on-base percentage reflects a player's plate discipline and ability to avoid outs. Understanding the balance between these statistics provides a comprehensive view of a player's contribution to the team's scoring opportunities.
Table of Comparison
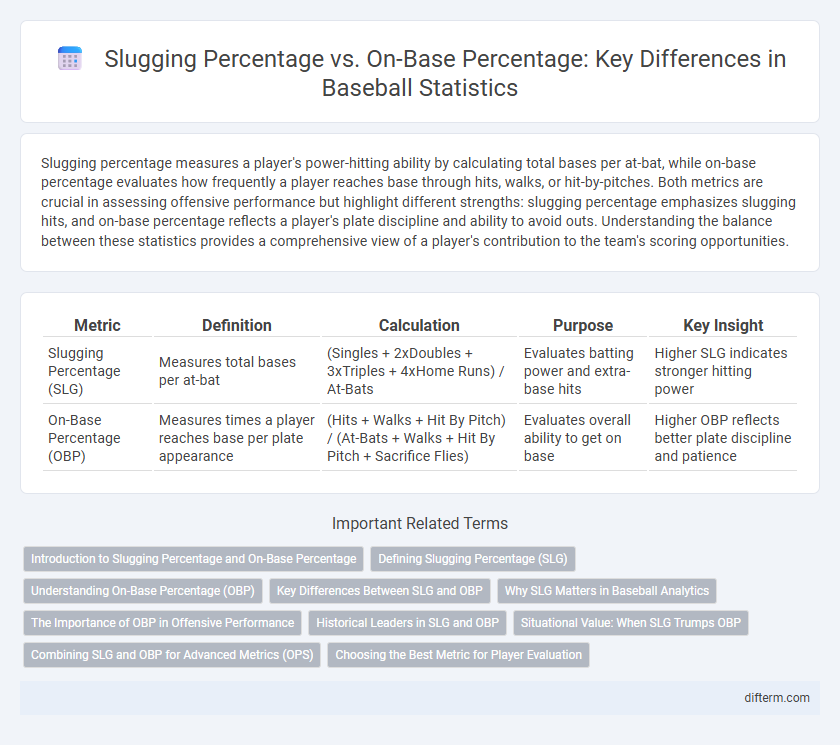
| Metric | Definition | Calculation | Purpose | Key Insight |
|---|---|---|---|---|
| Slugging Percentage (SLG) | Measures total bases per at-bat | (Singles + 2xDoubles + 3xTriples + 4xHome Runs) / At-Bats | Evaluates batting power and extra-base hits | Higher SLG indicates stronger hitting power |
| On-Base Percentage (OBP) | Measures times a player reaches base per plate appearance | (Hits + Walks + Hit By Pitch) / (At-Bats + Walks + Hit By Pitch + Sacrifice Flies) | Evaluates overall ability to get on base | Higher OBP reflects better plate discipline and patience |
Introduction to Slugging Percentage and On-Base Percentage
Slugging percentage measures a player's power-hitting ability by calculating total bases per at-bat, reflecting the quality of hits from singles to home runs. On-base percentage evaluates how frequently a player reaches base via hits, walks, or hit-by-pitches, emphasizing overall offensive effectiveness. Both metrics serve as crucial indicators for assessing baseball players' offensive contributions, with slugging highlighting power and on-base spotlighting plate discipline.
Defining Slugging Percentage (SLG)
Slugging Percentage (SLG) measures a baseball player's power by calculating total bases achieved per at-bat, assigning values of one for a single, two for a double, three for a triple, and four for a home run. Unlike On-Base Percentage (OBP), which gauges how often a player reaches base, SLG emphasizes extra-base hits to assess a hitter's offensive impact. This statistic provides insight into a player's ability to generate runs through hitting for power rather than just getting on base.
Understanding On-Base Percentage (OBP)
On-Base Percentage (OBP) measures how often a batter reaches base per plate appearance, incorporating hits, walks, and hit-by-pitches while excluding errors and fielder's choices. Unlike Slugging Percentage, which emphasizes power by accounting for total bases from hits, OBP reflects a player's ability to avoid outs and extend innings. High OBP is crucial for generating scoring opportunities, making it a key metric for evaluating offensive efficiency and plate discipline.
Key Differences Between SLG and OBP
Slugging percentage (SLG) measures a hitter's power by calculating total bases per at-bat, emphasizing extra-base hits such as doubles, triples, and home runs. On-base percentage (OBP) gauges a player's ability to reach base safely, including hits, walks, and hit-by-pitches, reflecting overall plate discipline and contact skills. The key difference lies in SLG focusing on power-hitting efficiency while OBP prioritizes on-base capability and plate appearance value.
Why SLG Matters in Baseball Analytics
Slugging percentage (SLG) measures a player's power by calculating total bases per at-bat, providing insights into extra-base hits and overall offensive impact. Unlike on-base percentage (OBP), which tracks how often a player reaches base, SLG captures the quality and explosiveness of hits, making it crucial for evaluating run production potential. Baseball analytics prioritize SLG to assess a hitter's ability to drive in runs and influence game outcomes through power-hitting.
The Importance of OBP in Offensive Performance
On-base percentage (OBP) provides a more comprehensive measure of a player's offensive value than slugging percentage (SLG) by accounting for all ways a batter reaches base, including walks and hit-by-pitches. Teams prioritize OBP because players who consistently get on base create more scoring opportunities and positively impact run production. High OBP correlates strongly with team success, making it a critical metric for evaluating hitters' contributions beyond just power hitting.
Historical Leaders in SLG and OBP
Historical leaders in slugging percentage (SLG) include Babe Ruth, whose career SLG of .690 remains the highest in MLB history, reflecting his unparalleled power-hitting ability. Ted Williams dominates on-base percentage (OBP) records with a career mark of .482, showcasing his exceptional plate discipline and ability to reach base consistently. Comparing SLG and OBP highlights the contrasting offensive skills of power versus patience among baseball's all-time great hitters.
Situational Value: When SLG Trumps OBP
Slugging percentage (SLG) provides crucial insight into a player's power-hitting ability, directly impacting run production by measuring total bases per at-bat. In high-leverage situations, such as late innings or with runners in scoring position, SLG often trumps on-base percentage (OBP) because extra-base hits drive multiple runs and shift game momentum. Teams focusing on situational value prioritize SLG to maximize scoring opportunities and capitalize on clutch moments.
Combining SLG and OBP for Advanced Metrics (OPS)
Slugging percentage (SLG) measures a hitter's power by calculating total bases per at-bat, while on-base percentage (OBP) reflects how often a player reaches base. Combining SLG and OBP yields on-base plus slugging (OPS), an advanced metric that provides a comprehensive assessment of a batter's overall offensive value. OPS is widely used in baseball analytics to evaluate player performance by incorporating both the ability to get on base and hit for power.
Choosing the Best Metric for Player Evaluation
Slugging percentage measures a player's power by calculating total bases per at-bat, highlighting extra-base hits' impact on scoring potential. On-base percentage gauges a player's ability to reach base via hits, walks, and hit-by-pitches, reflecting overall plate discipline and consistency. Selecting the best metric for player evaluation depends on the team's strategic focus, with slugging percentage emphasizing offensive power and on-base percentage prioritizing player reliability and run creation.
Slugging percentage vs on-base percentage Infographic